InfluxDB for Application Performance Monitoring (APM)
#1
Time Series Database
Source: DB Engines
1B+
Downloads of InfluxDB
Take the complexity out of time series data management
Try InfluxDBTurn high-volume, high-velocity, high-resolution time series data into actionable intelligence without sacrificing performance.
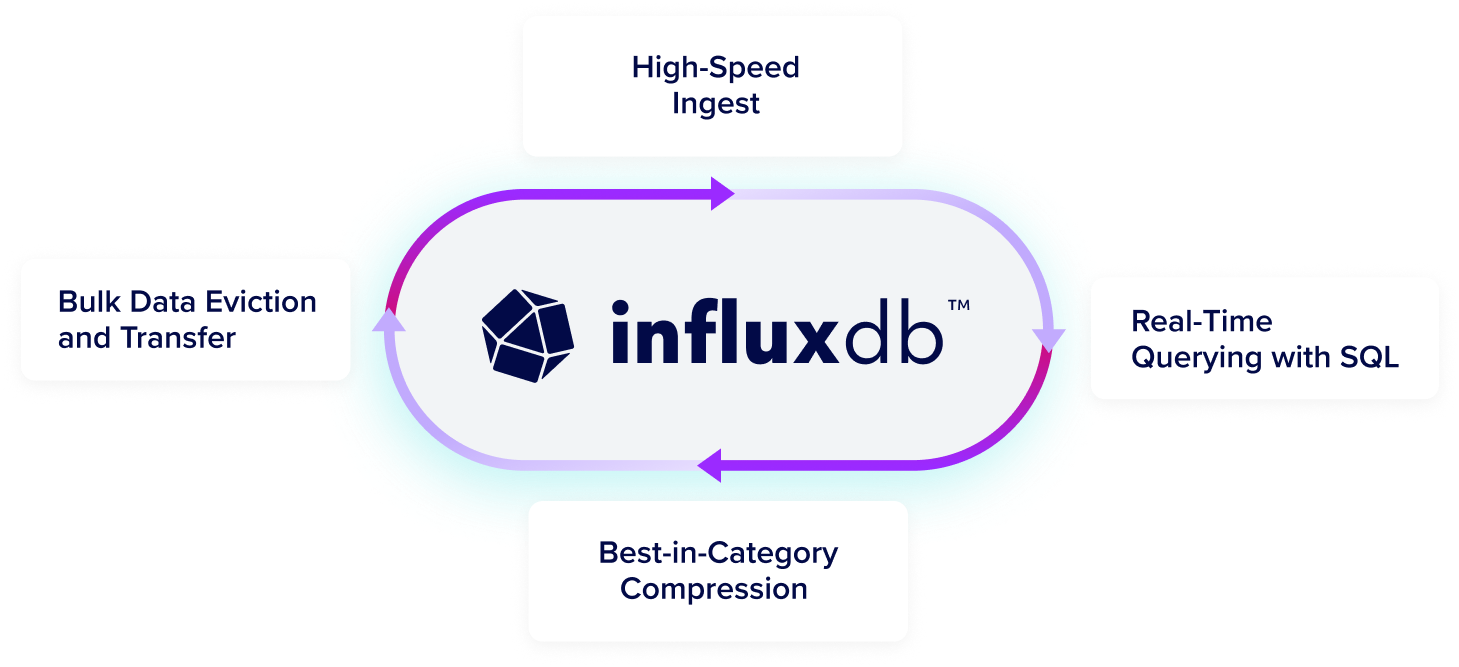
Get high-speed ingestion, real-time querying, and seamless scalability in a highly performant time series database that can handle unlimited volumes of time series data, even as data complexity and cardinality increases.
Run InfluxDB at scale in any environment in the cloud, on-premises, or at the edge. InfluxDB consists of the core database and storage engine, an API, and an ecosystem of tools and integrations to manage time-stamped data. Easily integrate with 5K+ prebuilt connections using Telegraf, our open source agent with 5B+ downloads.
Run InfluxDB 3 where you need it
Start for free, scale in seconds
Start NowFor small workloads and getting started
Deploy anywhere: on-prem, private cloud, edge, or multi-tenant cloud.
Secure, dedicated cloud infrastructure
Run a Proof of ConceptFor scaled workloads
Fully-managed, single-tenant service with unlimited scale, high availability, secure private connections, and enhanced Support.
Own your data with enterprise features
Run a Proof of ConceptFor scaled workloads
Control your infrastructure with unlimited scale, high availability, enterprise-grade security, and enhanced Support. On-prem, private cloud, and edge deployment.
Why InfluxDB
Limitless data collection
Ingest and analyze millions of time series data points per second without limits or caps.
Predict and prevent
Maximize uptime and prevent costly failures with real-time monitoring and preventative insights.
Real-time query
Data is immediately available for querying in InfluxDB, enabling real-time SQL queries and lightning-fast responses.
Why monitor your applications’ performance?
Application performance monitoring (APM) is the monitoring and management of performance and availability of software applications. APM aims to detect and diagnose complex application performance problems to provide end users with a high-quality experience and maintain expected levels of service.
Why InfluxDB for APM?
According to one recent study, every $1 invested in the user experience of your application will result in a return of approximately $100—in other words, it brings with it a return on investment of about 9,900%. Not only that, but about 39% of users will stop engaging with something if it takes too long to load or if it’s generally unpleasant to use. All of this underlines the importance of application performance monitoring quite nicely—even if your application does what you say it can do, people will still be slow to engage with it (if they choose to do so at all) if it’s difficult or cumbersome to use.
Meanwhile, you also have to balance this idea with the fast-paced digital economy we now live in—one where complexity is a given and a responsive application is no longer a recommendation but a requirement. Visibility into your entire application has become critical for enterprises, in order to offer the best experience possible to users.
An outstanding end-user experience is built on a solid time series data foundation. This is because performance indicators show change over time and are more actionable when examined in the context of real-time full-stack monitoring and transaction observation.
Get deep insights for early detection
Gain early detection of anomalies to help anticipate service disruptions. Use this insight to diagnose and identify root causes quickly, reducing time to remediation and recovery.
Monitor and optimize the user experience
User experience can be monitored by synthetic or real user traffic to keep experiences consistent and optimal, which translates to higher conversion and retention rates.
Automate workflows and provisioning
Intelligent triggers integrated with auto-remediation unload the burden from IT Ops teams and help them focus on struggling services and potential breakpoints before they impact user experience.
APM implementation approaches
Application performance monitoring can be implemented using various approaches: synthetic transaction monitoring, real user monitoring, and distributed tracing. All three approaches get to what matters most: keeping the user experience great.
Synthetic transaction monitoring (STM)
Synthetic transactions programmatically monitor user experience via scheduled use cases (emulate user traffic and load). STM is a cost-effective and proactive way to monitor the application and is useful during transition periods, upgrades, updates, and new functionalities, which are the most risky and error-prone situations.
Real user monitoring (RUM)
RUM provides a view from the user perspective. It reveals the real deal—real users doing what they do. RUM considers every contributing factor to the end-user experience—from service latency and bandwidth struggles to limitations at the client interface (e.g., mobile).
Distributed tracing monitoring
In distributed applications, a transaction can cross many boundaries: process, container, host, domain, and location. Maintaining performance visibility of causally related events in transaction execution is necessary to protect critical business workflows. Distributed tracing monitoring enables detection and preemptive remediation of struggles in any part of the execution path. In the event of an issue, it is an important tool for diagnosing the root cause when degradation or problems arise.
What is APM?
APM monitoring and various application performance monitoring tools can be used to accomplish a wide range of different things simultaneously. Some application performance monitoring software can be used by businesses to gain better visibility over their enterprises, always ensuring that everything meets performance standards. These tools can be used to collect and analyze data to help them identify bugs and potential issues, all in the name of offering superior user experiences via the close and real-time monitoring of all IT resources.
In other situations, application performance monitoring open source tools are used to gain additional insight into applications themselves. They’re very useful for development teams to learn more about how people interact with their software, along with issues they may be experiencing or concerns that may need to be addressed. These insights contribute to better, more informed decisions.
These types of tools can be used to identify a large number of scenarios, such as:
- Figuring out whether or not your applications or other assets are behaving as they should
- Alerting important team members to issues and providing data necessary to get to the source of the problem
- Helping teams understand the impact that these issues might have on their business
- Adapting an application environment to fix similar problems today before they have a chance to repeat themselves tomorrow
In other words, APM monitoring is all about context. If you know not just that something has gone wrong but WHAT went wrong and WHEN, you can work your way back to WHY it happened at all. At that point, you know everything you need to fix the problem so you can get back up and running.
Who is APM for?
The two main types of industry groups who benefit greatly from application performance monitoring are IT professionals who deal with maintaining the health of large environments and any development team that creates applications for end-users.
For the former group, APM monitoring is an invaluable way to guarantee that everything works exactly as it should—to guarantee that people have access to the IT resources and larger environment necessary to do their jobs. The latter group uses APM monitoring to help ensure they have A) the best app possible and B) one that functions with as few issues as possible to help create engaging user experiences.
In fact, any professional who deals with user experiences can benefit from the insight and analysis that the right application performance monitoring tools offer.
InfluxDB for application performance monitoring
APM can be performed using InfluxData’s platform InfluxDB. InfluxDB is a purpose-built time series database, real-time analytics engine, and visualization pane. It is a central platform where all metrics, events, logs and tracing data can be integrated and centrally monitored.
Implementations using InfluxDB for application performance monitoring include:
- Optimization of end-user experience and purchase transactions in e-commerce spaces (Wayfair Case Study, and Web Shop Fly webinar and application performance monitoring blog)
- Online monitoring of transactions in online gambling and gaming platforms (Playtech case study)
- Real-time monitoring of website availability and performance via end-user emulation (xOps solution)
- Observation of cluster backup transactions in cloud environments (InfluxData Site Reliability implementation)
- Root cause identification to improve network monitoring, APM, and visibility (Riverbed)
Read more about application monitoring implementations made available by the InfluxDB community:
Telegraf Zipkin plugin: Zipkin tracing data can be collected via Telegraf and sent to InfluxDB.
Jaeger InfluxDB plugin: gRPC client plugin is used to collect tracing data and send it to InfluxDB.
Synthetic transaction monitoring: xSum emulates the user journey through a site or web application, ensuring that transactions take place error-free. All data is stored in InfluxDB.
Load testing: Flood.io is a distributed load testing platform that supports testing with open source tools like JMeter, Gatling, and Selenium. The platform collects and aggregates real-time data from the tests conducted by its customers in InfluxDB Cloud.
“We recently introduced InfluxDB as our first-class time series database system, where we had the opportunity to work directly with InfluxData to ensure we were on a path that is scalable, robust, and in line with the future direction of their platform.”
Mike BellEngineer, Wayfair
Open data standards drive performance and interoperability
InfluxDB 3 is built in Rust and the FDAP stack—Flight, DataFusion, Arrow, and Parquet—leveraging Apache-backed technologies to efficiently ingest, store, and analyze time series data at any scale.
Try InfluxDBF
Flight for efficient columnar data transfer

D
DataFusion for high-performance querying
A
Arrow for optimized in-memory columnar analytics

P
Parquet for high-compression storage
InfluxDB’s columnar database supports time series data at a lower TCO
See ways to get started
Loved by developers, trusted by enterprises
65M+
daly events processed
45x
more resource efficient
Siemens Energy
"[We] long used InfluxDB open source... Moving to commercial InfluxDB was a strategic move to unify our data infrastructure, ensuring we have the reliability, scalability, and real-time performance to keep pace with production... and proactive maintenance."
Jan Petersen
Senior Manufacturing Engineer
500M+
Metrics collected daily
Mission-critical monitoring
Real-time data access for queries
LOFT ORBITAL
Space Made Simple: How Loft Orbital Delivers Unparalleled Speed-to-Space with InfluxDB Cloud
Read Case Study65M+
daly events processed
45x
more resource efficient
CAPITAL ONE
"InfluxDB is a high-speed read and write database. The data is written in real-time, you can read it in real-time, and while reading, you can apply your machine learning model. So, in real-time, you can forecast and detect anomalies."
Rajeev Tomer
Sr. Manager of Data Engineering
50%
lower total cost of ownership
100K
real-time metrics with simplified deployment
TERÉGA
Teréga Replaced Its Legacy Data Historian with InfluxDB
Lorem ipsum
Lorem ipsum dolor sit amet consectetur.
65M+
daly events processed
45x
more resource efficient
WIDEOPENWEST
"I was blown away with how easy it was to install and configure InfluxDB. The clustering was easy. The documentation was great, and the support has been second to none."
Dylan Shorter
Engineer III, Software and Product Integration Engineering
45%
Less equipment downtime
10%
Reduced waste
MAJIK SYSTEMS
From Reactive to Proactive: How MAJiK Systems Embraced Predictive Maintenance with InfluxDB and Time Series Data
Dylan Shorter
Engineer III, Software and Product Integration Engineering
65M+
daly events processed
45x
more resource efficient
JU:NIZ ENERGY
"With InfluxDB Cloud Dedicated, the great thing is that we don't need to think about data storage costs or usage anymore because data storage gets way cheaper."
Ricardo Kissinger
Head of IT Infrastructure and IT Security


