Google Data Studio Monitoring
Powerful performance with an easy integration, powered by Telegraf, the open source data connector built by InfluxData.
5B+
Telegraf downloads
#1
Time series database
Source: DB Engines
1B+
Downloads of InfluxDB
2,800+
Contributors
Table of Contents
Powerful Performance, Limitless Scale
Collect, organize, and act on massive volumes of high-velocity data. Any data is more valuable when you think of it as time series data. with InfluxDB, the #1 time series platform built to scale with Telegraf.
See Ways to Get Started
Google Data Studio is a free tool made available by Google that allows users to generate custom reports with data collected not only from Google's own marketing services, but from a variety of different external sources as well. This is an ideal solution for people who already enjoy the data visualization and dashboards provided by Google Analytics, but who are looking for an opportunity to take that insight one step further.
Everything in Google Data Studio is organized by a series of data widgets, all of which can be fully customized to meet your needs. In addition to presenting live data in real-time, you can also sort things by column, make adjustments to table pagination and perform any other alterations you'd like.
Just a few of the Google products that can act as data sources include but are not limited to Google Analytics, AdWords, the Search Console, Google Sheets and even YouTube, among others. External sources can include database connectors, file upload and "community" connectors that are available from many of the popular marketing services you're probably already using.
Regardless of how you choose to configure it, the overall benefit is clear: Google Data Studio helps you instantly create informative dashboards that are easy to build, even easier to share and that derive powerful insights from your data, no matter what.
Why use InfluxDB with Google Data Studio
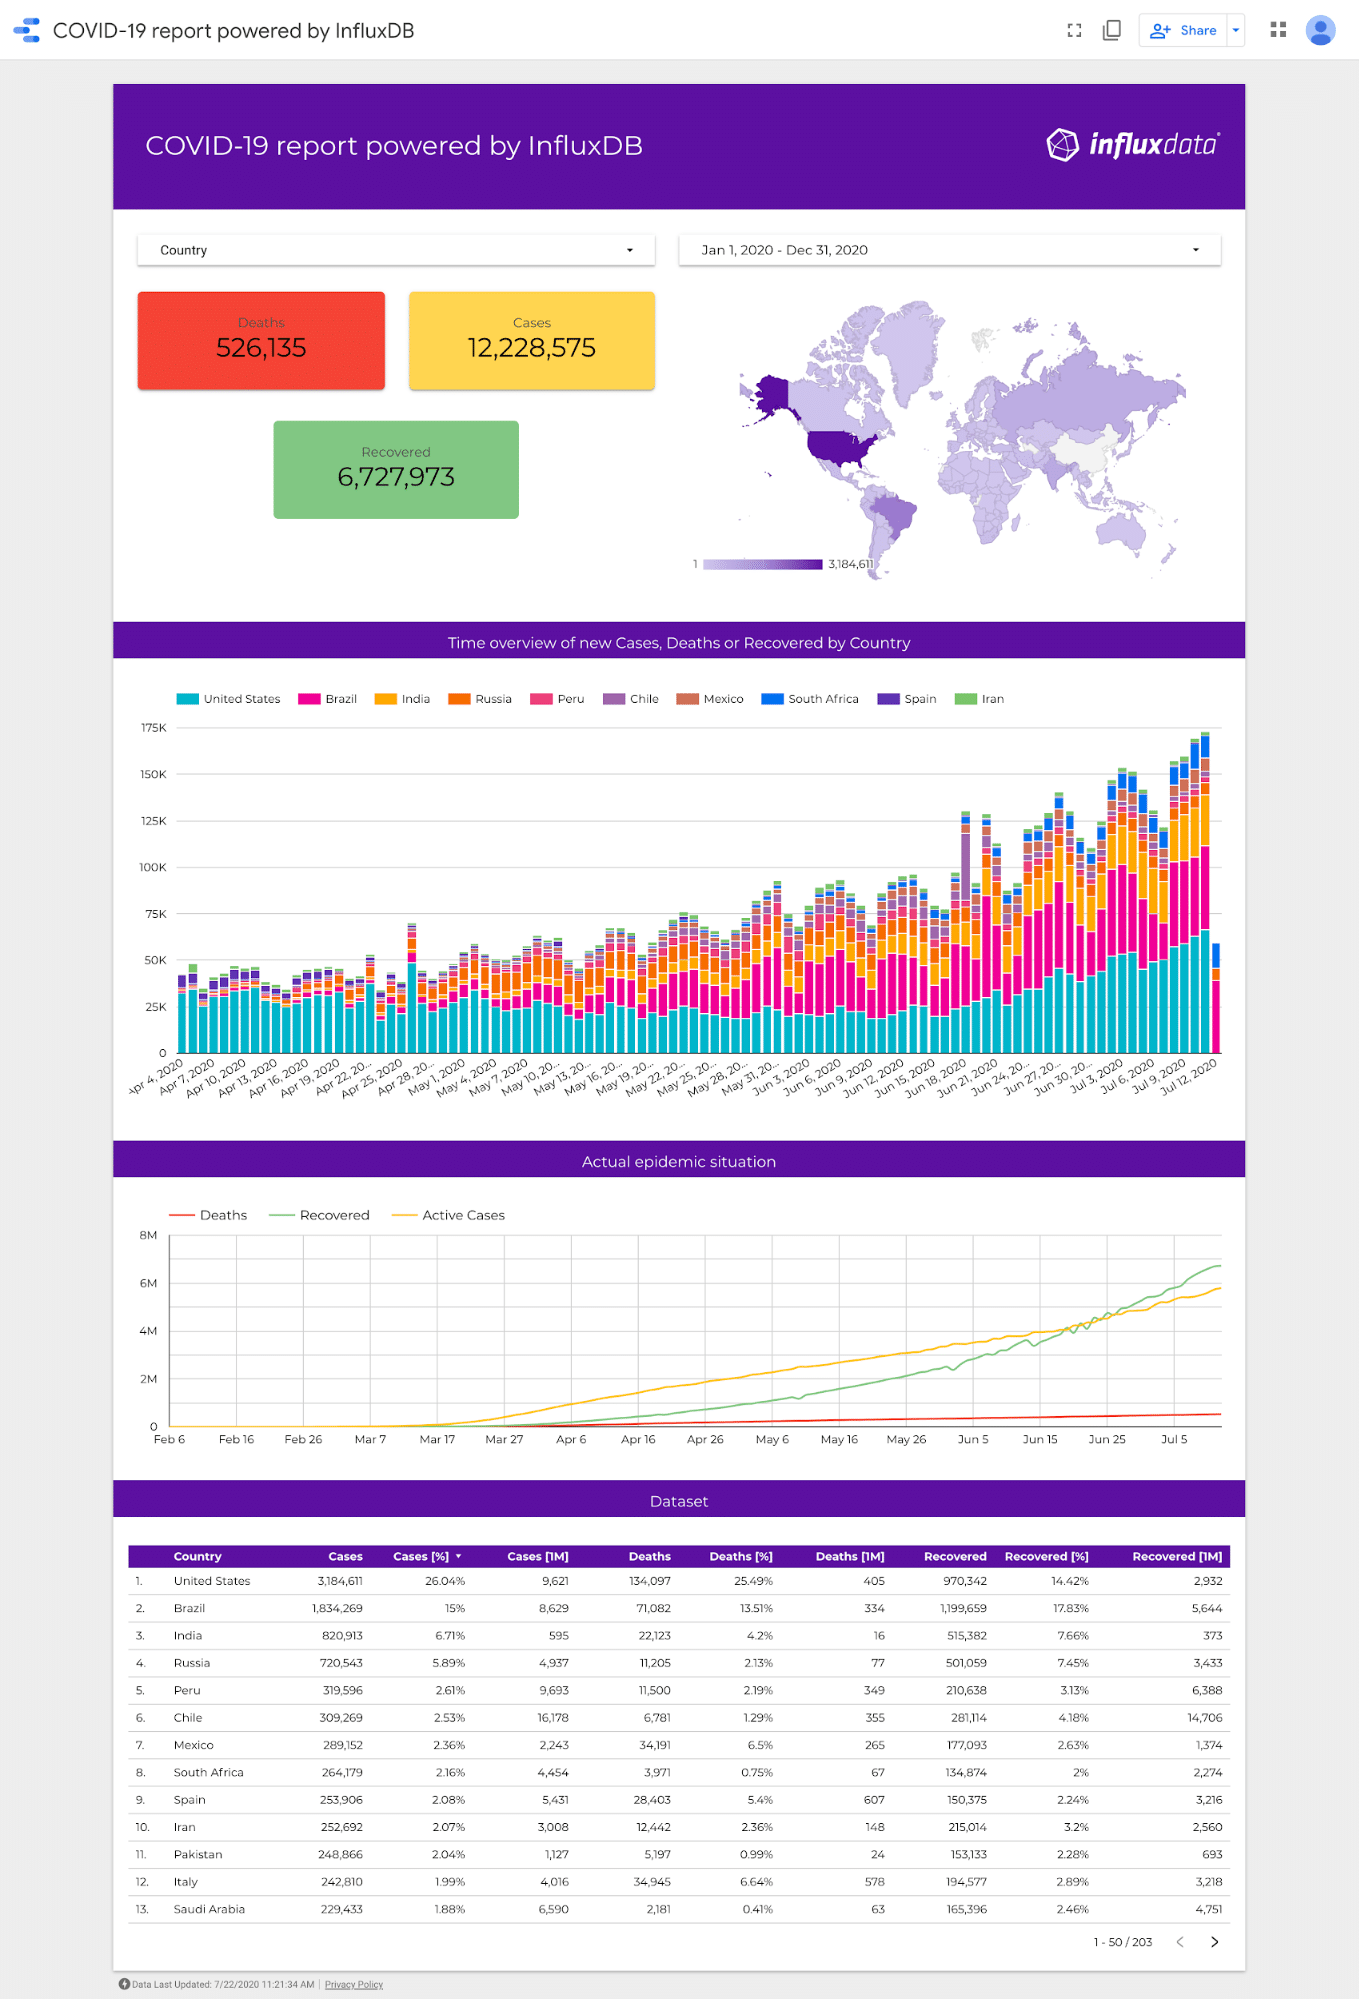
The InfluxData platform comes with a Google Data Studio connector that allows users to query time series data from their InfluxDB instance to build these Data Studio dashboards. Within these dashboards, users can pull data from their InfluxDB instance as well as from multiple other sources such as Google Bigtable, BigQuery or even Firebase to build comprehensive dashboards that help developers understand the complete picture of their solution.
How to use the InfluxDB Google Data Studio connector
Getting started with InfluxDB and the Google Data Studio connector is simple. First, you need to get an instance of InfluxDB and add your data. You can do this by creating an InfluxDB Cloud account. InfluxDB Cloud starts with a free tier that offers a generous amount of writes and queries to InfluxDB from your Data Studio dashboard. Alternatively, you can also download and use the latest beta version of InfluxDB 2.0 to build your dashboards upon.
Once you have your instance ready, you can start collecting your time series data with one of the 200+ Telegraf plugins, client libraries or 3rd party data collectors. You can then use the Certified Direct Connection with the Google Data Studio API to create your first dashboard. Once you have added the InfluxDB connector, you will need to provide your InfluxDB connections details including:
InfluxDB URLTokenOrganizationBucketMeasurement
Once your InfluxDB instance is connected, you can see a list of fields available from your Measurement (tagset, fieldset, and timestamps). From there, you can start building your dashboards.
Key Google Data Studio metrics to monitor
After connecting your InfluxDB instance to Google Data Studio, the latter will show you a list of all the various fields available from your measurement in the former. Just a few of the key metrics that you should monitor include:
- Current heap size
- Number of shard write errors
- Number of series for the specified databases, also known as series cardinality
- Number of measurements, by database
- Duration of the top 1% of HTTP requests, normally measured in nanoseconds
- Number of points requested by hostname every minute
- Number of queries executed per minute
- Number of HTTP requests per minute

Acceptable Use Policy
InfluxDB Cloud 2.0: Services Subscription Agreement
Powerful Performance, Limitless Scale
Collect, organize, and act on massive volumes of high-velocity data. Any data is more valuable when you think of it as time series data. with InfluxDB, the #1 time series platform built to scale with Telegraf.
See Ways to Get Started

