Volvo Uses InfluxDB to Evolve Its DevOps Monitoring to Enable Data-Driven Decisions
By
Jason Myers /
Product, Use Cases, Developer
Jan 14, 2022
Navigate to:
Production delays or stoppages are the bane of any manufacturer. When you’re a global automaker like Volvo, even the smallest delays can have significant ripple effects. But not even global leaders are immune to IT issues.
This was the situation Volvo faced several years ago. It had a legacy DevOps monitoring solution in place for the previous 15–20 years, but that system no longer met the company’s needs. On the surface, it seems like a robust system. In fact, it monitored 99.8% of Volvo’s IT components. However, the system had outdated or inaccurate thresholds for many components, so it failed to produce actionable data that developers wanted or needed.
In addition to the purely technical challenges, only a small team of people had access to all the data that the solution collected. It fell to this team to take the initiative to notify other team members when an issue arose. This created a lack of transparency where Volvo developers often found out about issues only after they reached a critical inflection point. As IT-related issues increased, it was when these issues started to impact production on the factory floor that the Volvo team realized it was time for a change.
Volvo’s DevOps Enablement team took this opportunity to develop a new monitoring and alerting solution that provided more accurate and actionable data, proactive alerting, and greater transparency for the entire development team.
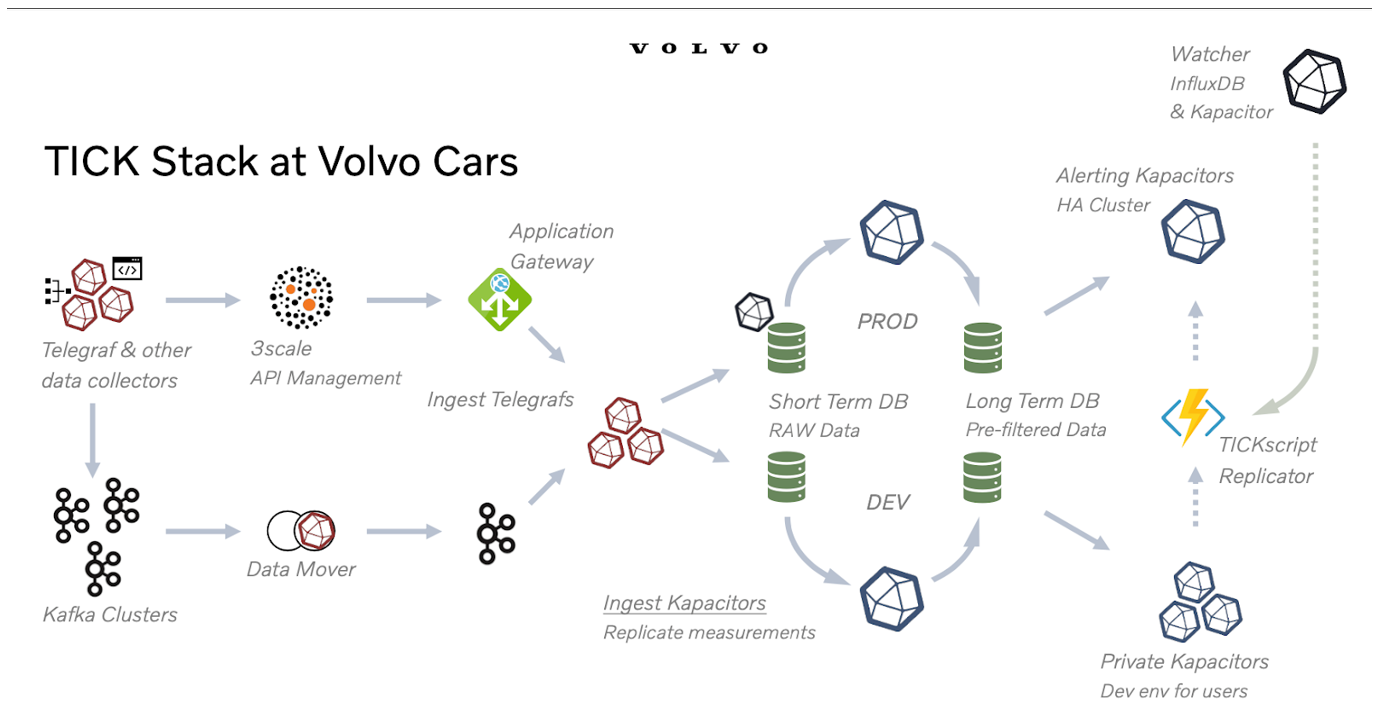
The team started by using Grafana to visualize all their data to get a better sense of the extent of the issues. Once the team fully understood the scope of the situation, they built a completely new monitoring stack with InfluxDB at its core.

Volvo uses several different methods to collect data depending on type and source, including Telegraf, custom scripts, and Kafka. All collected data gets routed through Telegraf, which replicates the data and writes it to databases in both development and production clusters. Having the same data in both places allows the team to test out updates on the same data that’s hitting production services. This enables them to see the results of updates in real time and to push test code to production quicker.
The data collected by Telegraf and analyzed by InfluxDB then feeds a Grafana service for visualization. The DevOps Enablement team granted wide access to this service to provide greater transparency for monitoring data. Teams within Volvo can set and maintain thresholds more easily in the new system. Some teams even have their own Kapacitor clusters for alerting, where they can test updates and quickly push them to production.
By granting wide access to the new monitoring system, Volvo’s DevOps Enablement team improved monitoring transparency, increased developer accountability, and streamlined development processes, making it easier and more effective for developers to build and deploy code. Overall, the new monitoring solution helped Volvo become a more data-driven company.
For more details on how Volvo uses InfluxDB, check out the full case study.
