TL;DR InfluxDB Tech Tips — Creating a Telegraf Configuration with the InfluxDB UI
By
Anais Dotis-Georgiou
Product
Use Cases
Developer
Oct 13, 2021
Navigate to:
The InfluxDB UI offers a wide variety of features for time series analysis, data lifecycle management, and time series visualization. The InfluxDB UI also shines when it comes to onboarding new users, whether they’re an InfluxDB OSS or free tier InfluxDB Cloud user. The InfluxDB UI allows you to easily leverage Telegraf, a plugin-driven collection agent for collecting, processing, and writing metrics and events. Users can use InfluxDB UI to select from hundreds of different Telegraf plugins, create a Telegraf configuration, and help them run Telegraf. Furthermore, now users can add additional plugins to an existing Telegraf configuration with the InfluxDB UI which provides users with all of the flexibility and power that Telegraf offers.
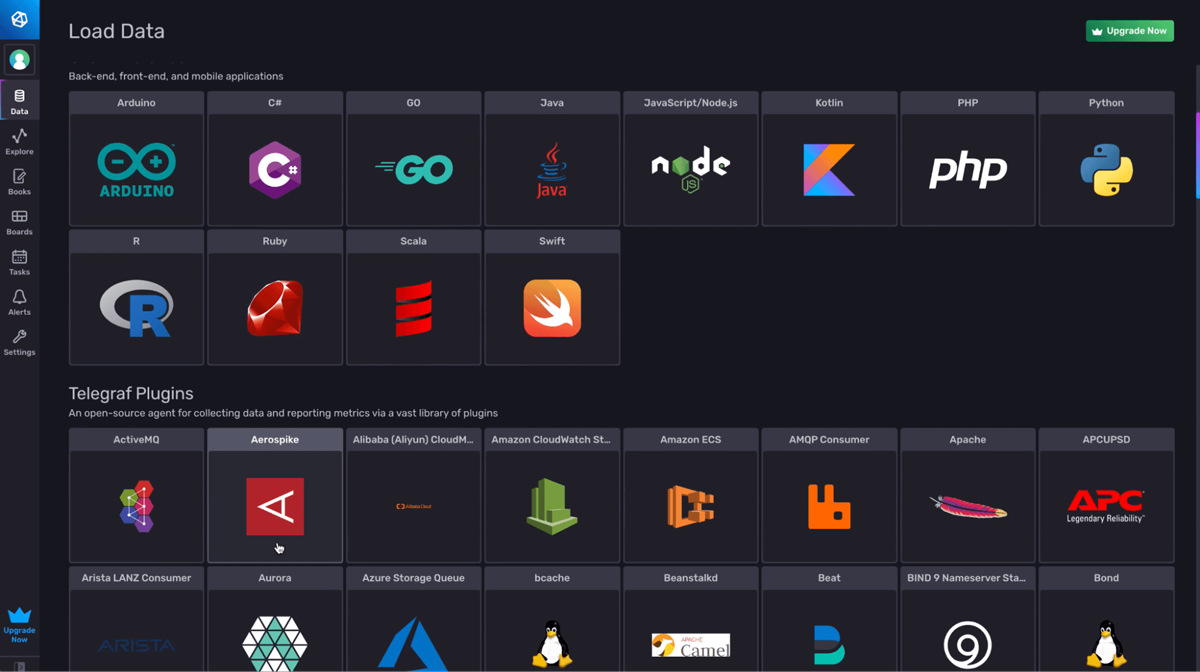
To create a Telegraf configuration in the InfluxDB UI, navigate to the Data tab and select the plugin you want to add under the list of Telegraf Plugins. Alternatively, you can also search for the plugin you want to use at the top of the Data tab.
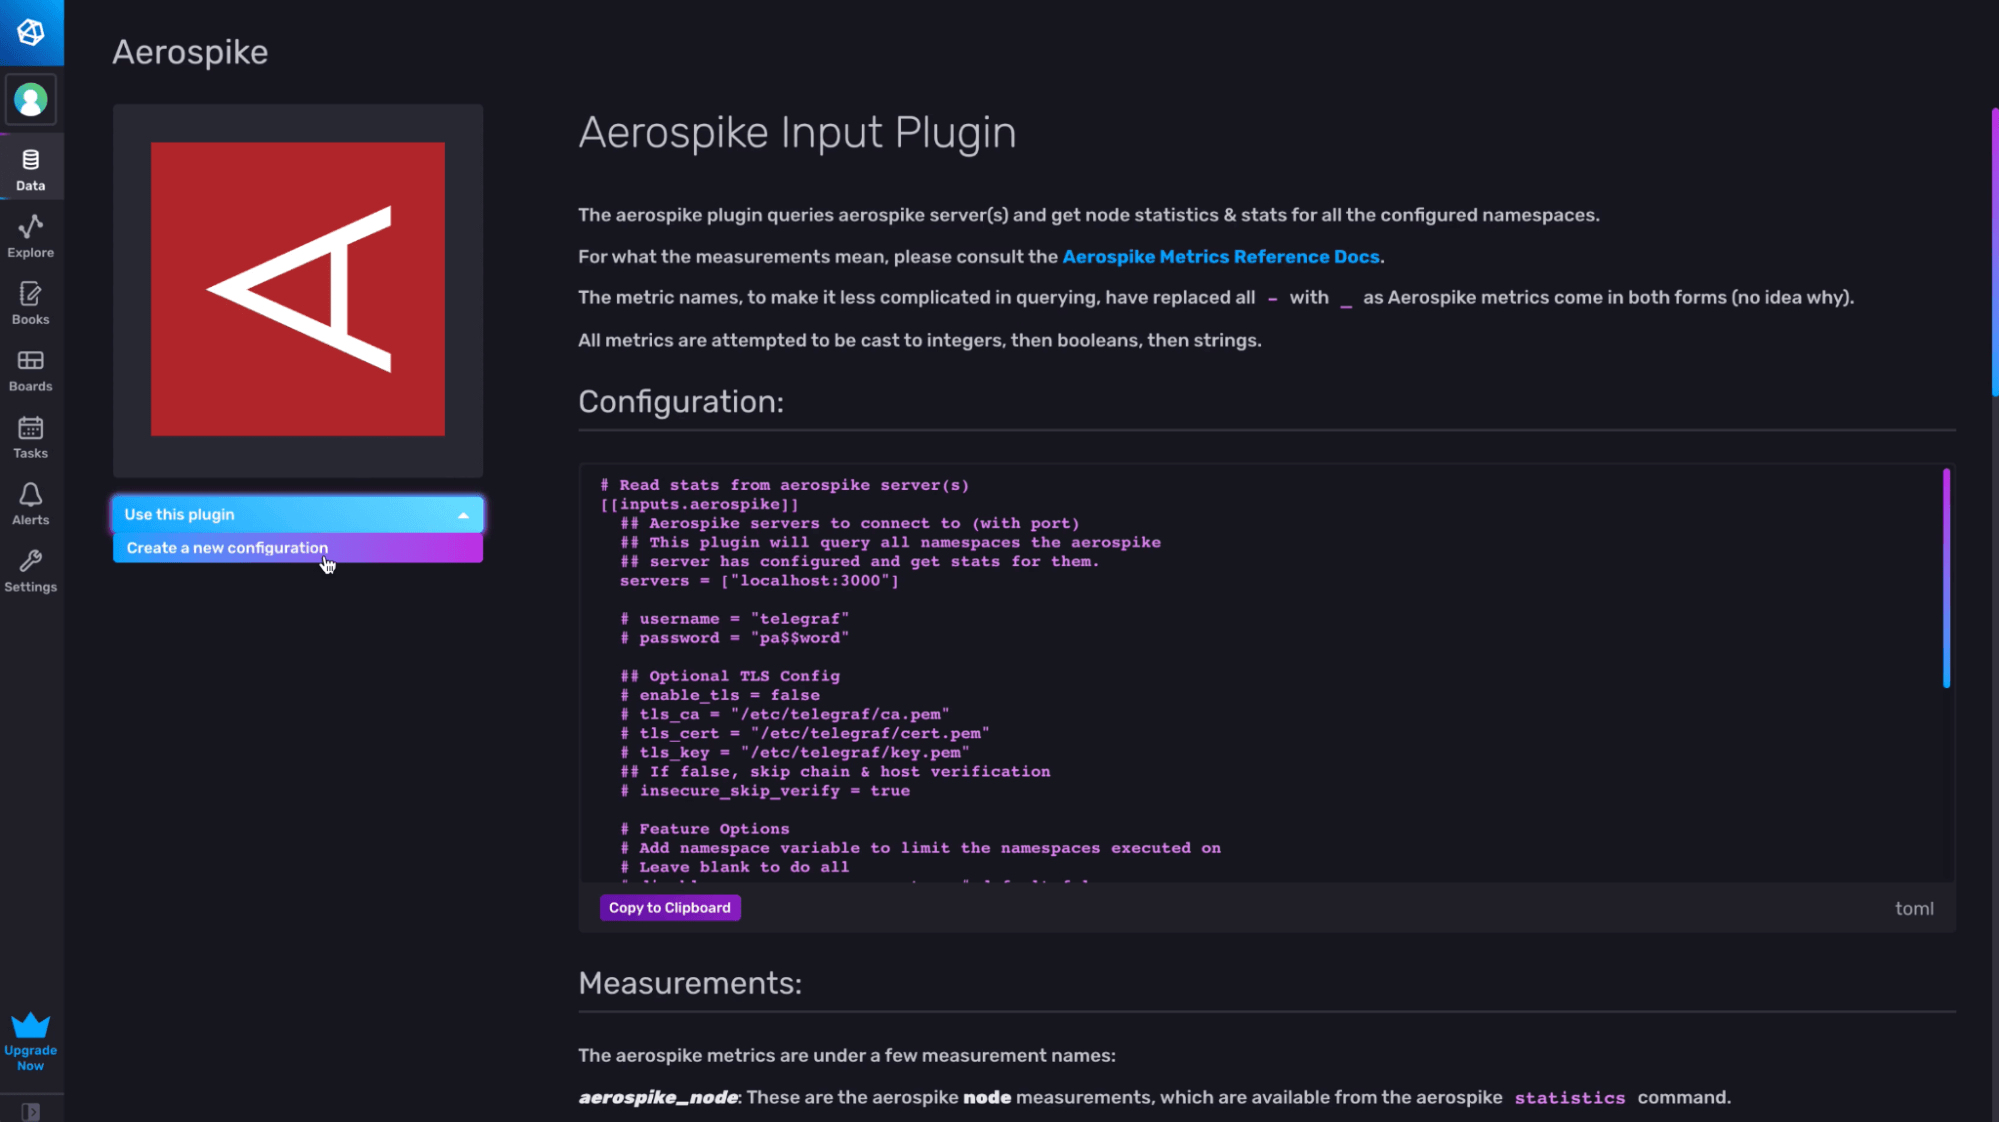
Next, select Create a configuration from the dropdown.
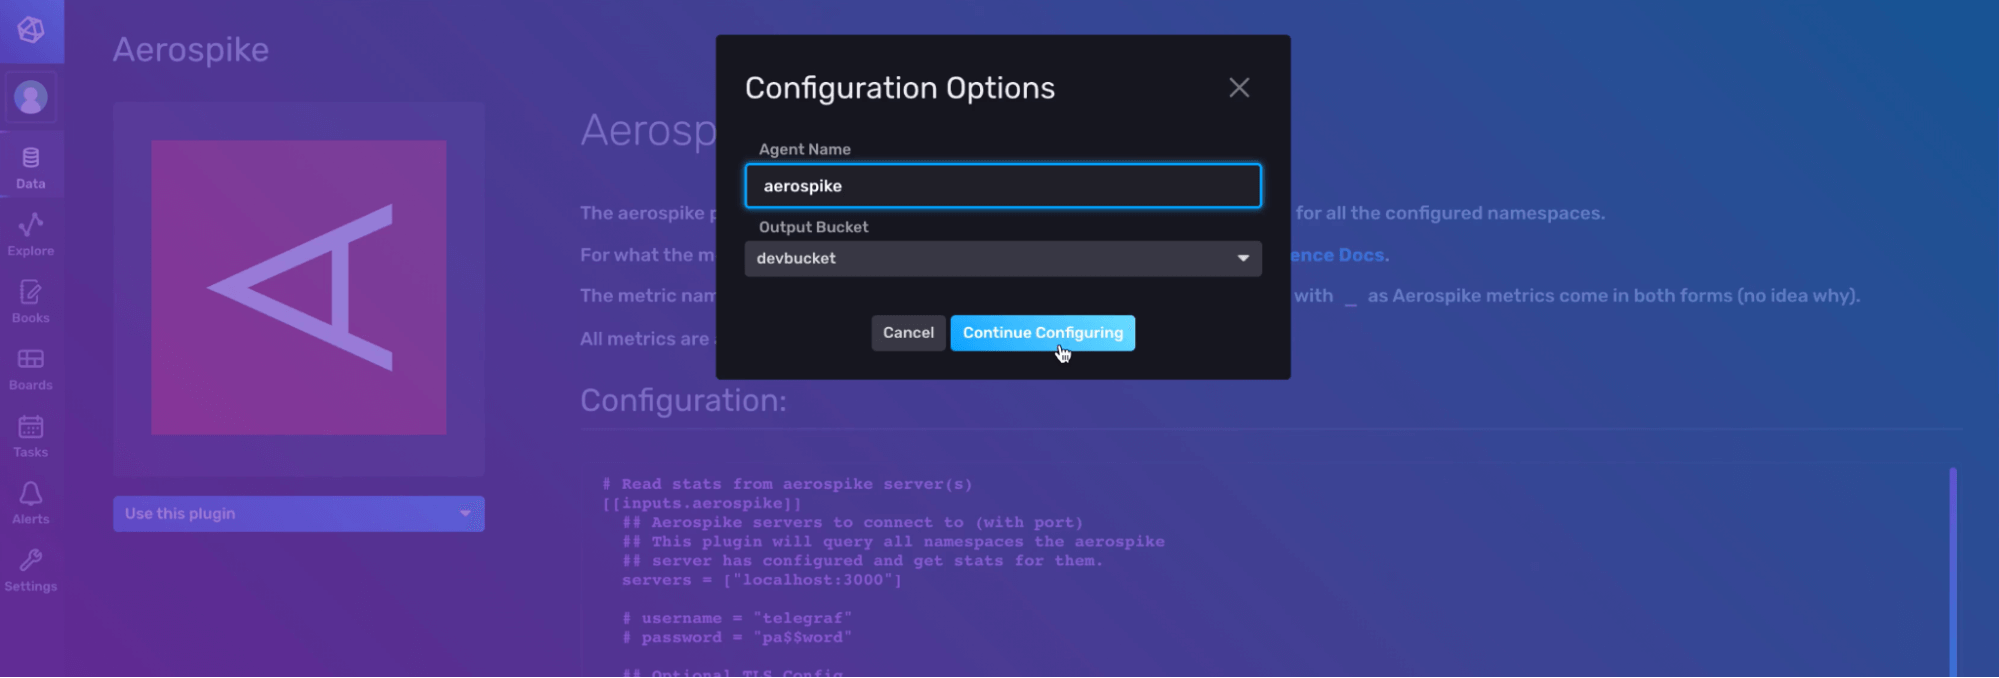
Now you can name your Telegraf config and either:
- Select the bucket that you want your Telegraf agent to write data to.
- Create a new bucket to write data to.
In the screenshot below, the user names their configuration “aerospike” and selects the “devbucket” as their output bucket.
Select Continue Configuring to proceed to the next step where you can add a Telegraf configuration description (optional) and edit any portion of your configuration. To learn more about how to configure individual plugins, find your plugin and visit GitHub for documentation on your selected plugin.
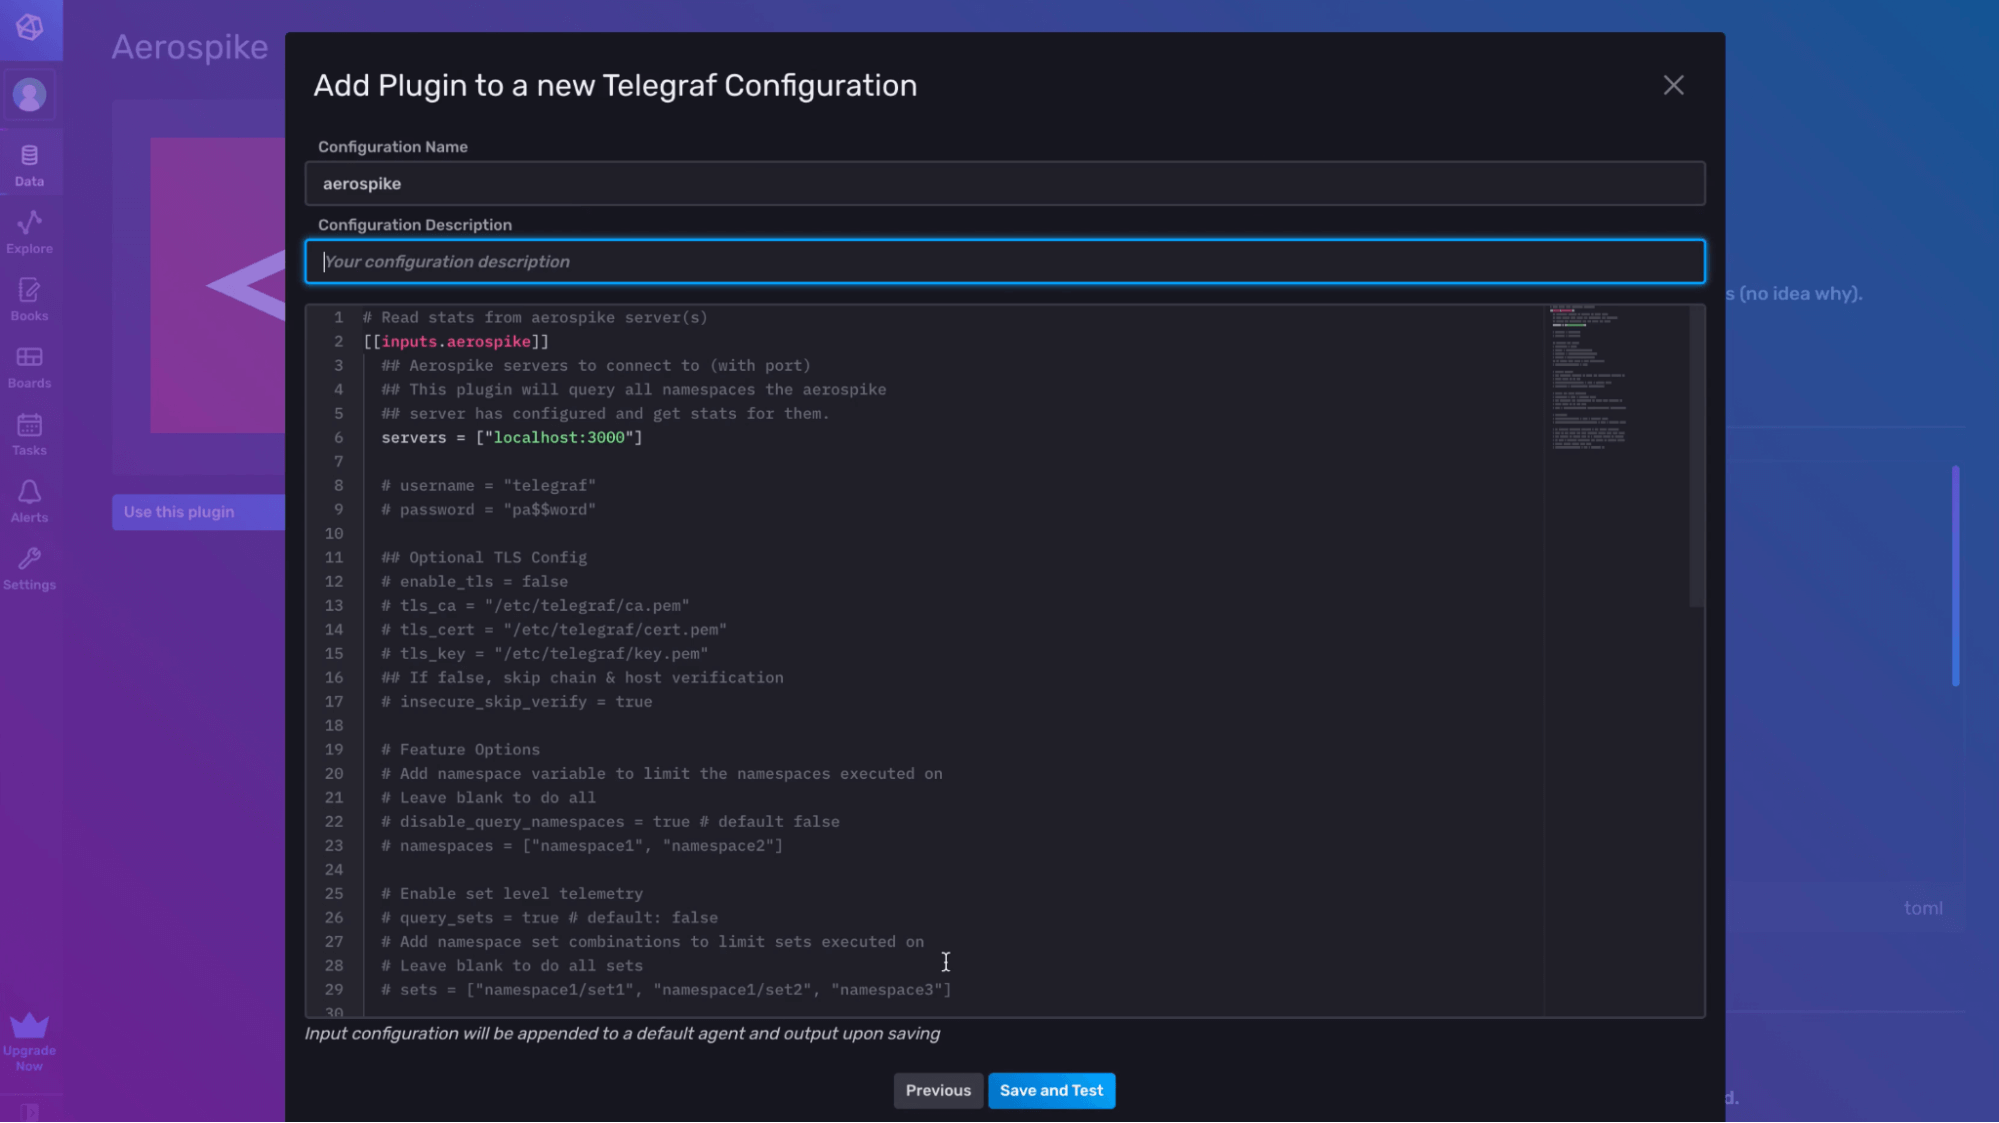
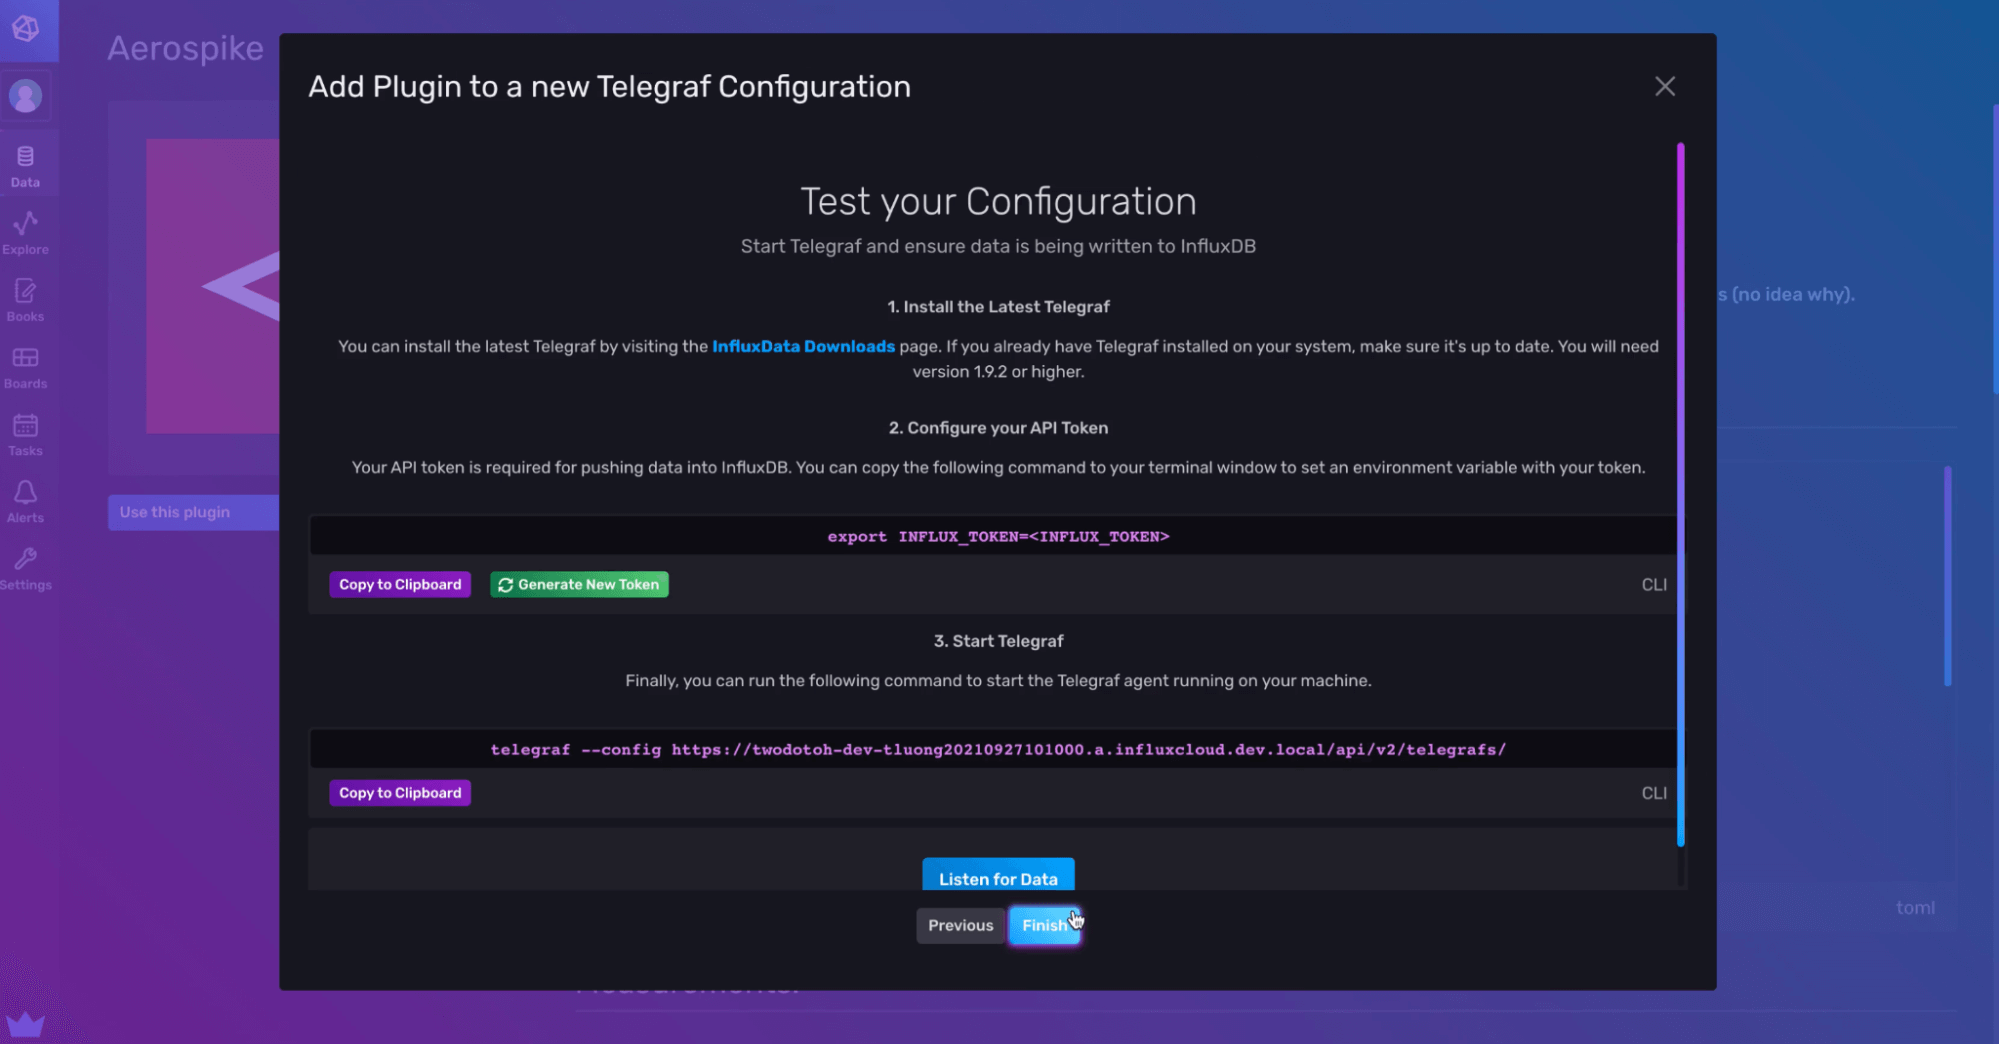
Finally, click Save and Test to bring you to the setup instructions page. Follow those instructions to:
- Install Telegraf (if you haven't already)
- Configure an API token
- Start Telegraf
Click the Listen for Data button to verify that you’re successfully collecting and writing data with Telegraf. Hit Finish when you’re done to return to the Telegraf page where you can view a list of all of your Telegraf configurations and follow the setup instructions from there as well.
Add a plugin to an existing Telegraf configuration with the InfluxDB UI
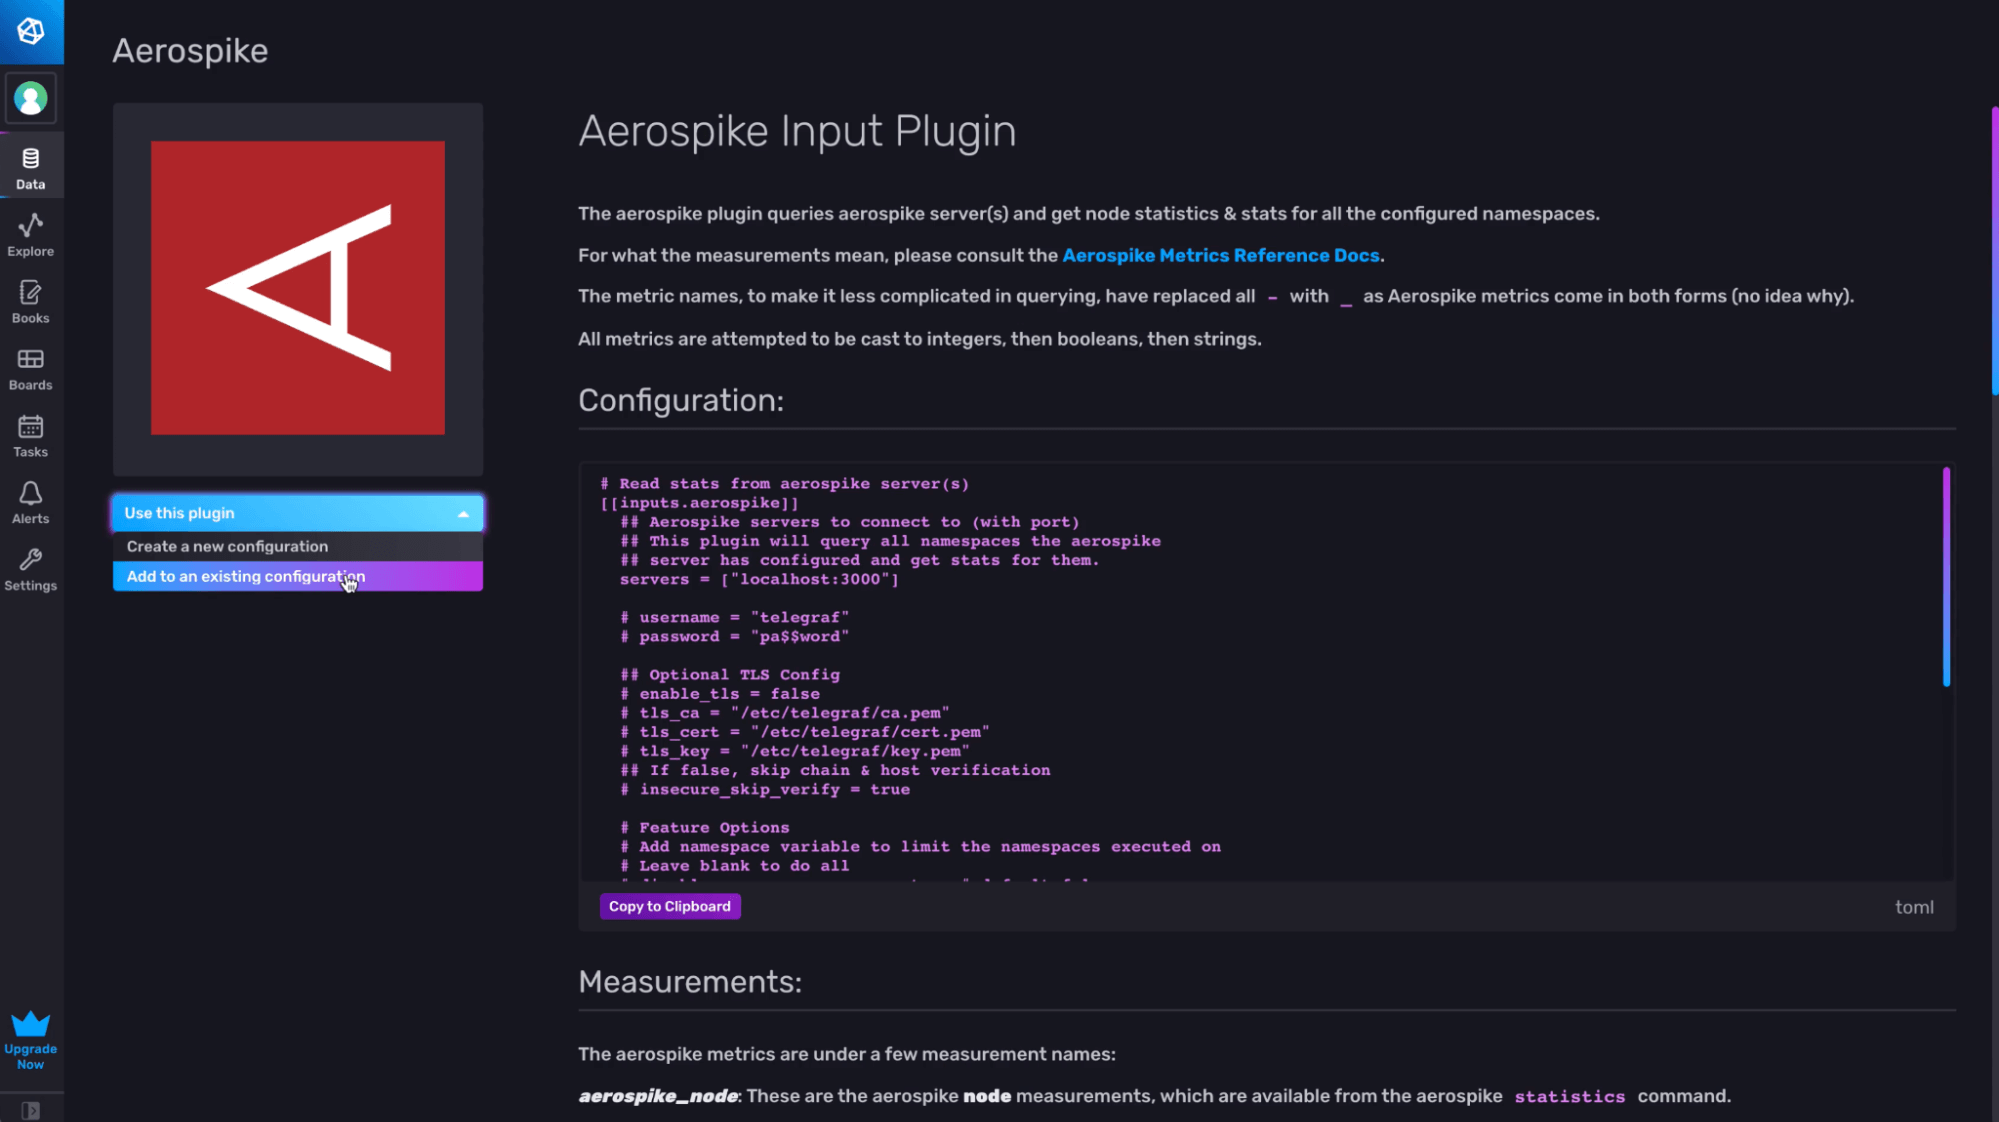
To add another plugin to an existing Telegraf configuration file, navigate to the Data tab and select the additional plugin you want to add under the list of Telegraf Plugins. In the screenshot below, the user is adding an additional Aerospike Input Plugin to their existing “aerospike” configuration which already contains one Aeropsike Input Plugin.

Next, select the dropdown to Add to an existing configuration.
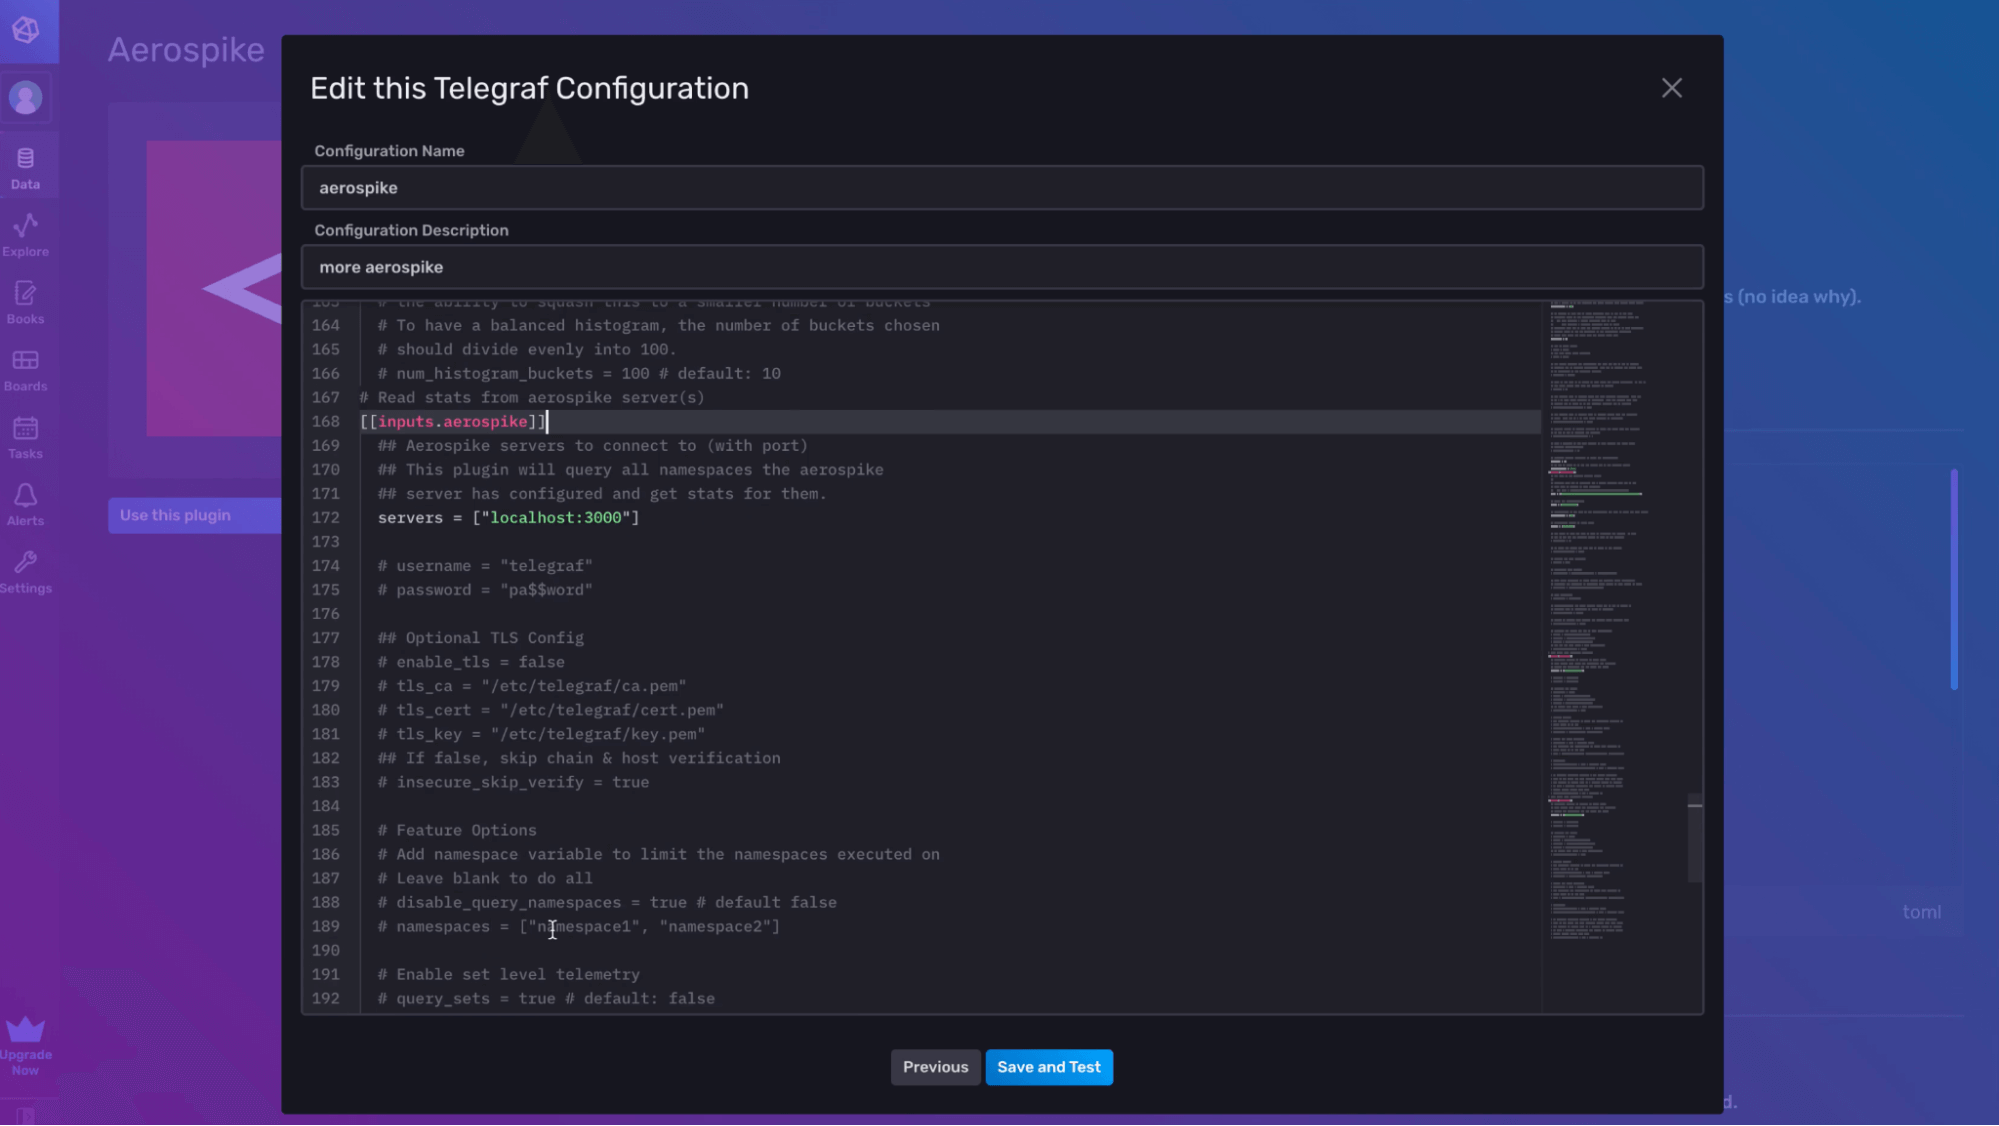
Finally, select the existing Telegraf configuration that you want to add an additional plugin to and click Add to Existing Config. The user is adding a second Aerospike Input Plugin to an existing Telegraf config named “aerospike”.

That’s all there is to it! Now you can verify that your Telegraf config contains the plugins you want and make any necessary edits to the configuration, name, and description before hitting Save and Test.
Conclusion on adding additional plugins to your Telegraf configuration
I hope this post inspires you to try out the InfluxDB UI for creating and configuring your Telegraf configurations. If you are using the InfluxDB UI or Telegraf and need help, please ask for some in our community site or Slack channel. If you’re developing a cool IoT application on top of InfluxDB, we’d love to hear about it, so make sure to share your story! Additionally, please share your thoughts, concerns or questions in the comments section. We’d love to get your feedback and help you with any problems you run into!
