Drill Baby Drill! Data Exploration in Chronograf
By
Will Faurot /
Product
Dec 15, 2015
Navigate to:
Overview
First thing, download the latest version of Chronograf here.
Will from Chronograf here! In this post we’ll take a look at a few of the ways Chronograf allows you to explore your data from InfluxDB. Before we get started, let’s take a look at InfluxDB, time series, and why data exploration is such an important feature in a visual tool like Chronograf.
InfluxDB is optimized for time series data. More often than not, a whole lot of it. Scale is critical in the time series world. When you’re dealing with datasets in the gigabyte, terabyte, or even petabyte range, you could be navigating hundreds if not 1000+ different metrics as well as accompanying metadata. That’s a lot of things. From the beginning, Chronograf was designed with this idea of “drilling down” into data. We start with a large dataset, and filter down into smaller subsets based on selecting measurements and/or tags.
Building Blocks for Exploration: Measurements, and Tags
In this post we’ll focus on measurements and tags, but a full glossary of InfluxDB terms is available here.
Measurements and tags are two of the fundamental building blocks in InfluxDB, and likely where you’ll start when building out queries with Chronograf. Before getting to the examples let’s start with a good working definition of each concept:
- Measurements - these are your metrics. We're using Telegraf in these examples, a plugin-driven server agent for reporting metrics into InfluxDB. It can track system metrics like cpu and disk usage, as well as services like Redis and ElasticSearch.
- Tags - key/value pairs used to provide metadata (e.g. region=us-west, host=server01).
Drilling Down
We figure there are at least two common use cases for building queries within Chronograf:
- You know what you're looking for. You have a query in mind and just want to see a visual representation of your data.
- You want to explore. Maybe you have 100+ measurements and want to see which metrics you're tracking in one region. Or it could be the inverse, and you want to see which regions are tracking what measurements. This use case is hugely important to us and is the focus of this post.
Querying for Fun and Profit
Here’s the gist:
- Choosing a measurement can reduce the list of available tags
- Choosing tags can reduce the list of available measurements and subsequently available tags
In these examples we’ll be focusing on the Filter By pane in the query editor:
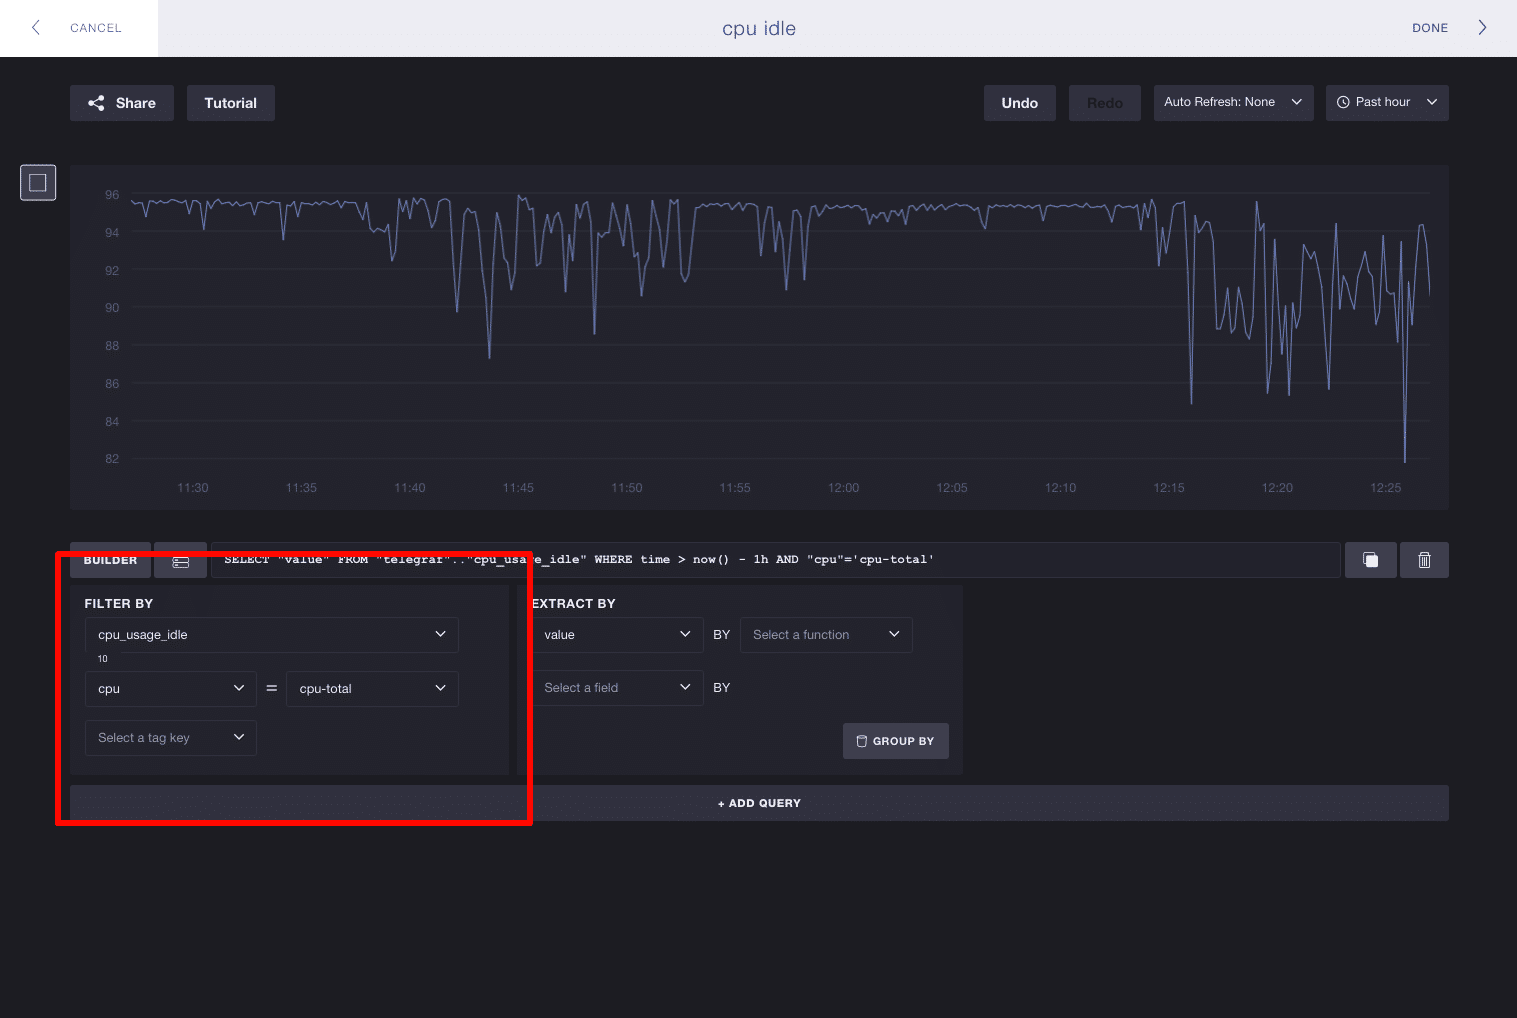
When you start building a query, you’ll have the all of your measurements and tags available in the ‘Filter By’ pane. In these examples I’m using Telegraf to track system metrics, where I have 31 measurements and 3 tag keys. Here we’ll pick the measurement cpu_usage_idle. The list of available tag keys is reduced from 3 to 2, meaning cpu and host are the only tags associated with cpu_usage_idle:
The inverse works as well - you don’t have to select a measurement to start exploring tags. Each tag key/value pair can potentially reduce the list of available measurements. Here we’ll take a look at the full list of tags and select the key cpu. You can see this reduces the number of available measurements from 31 to 10, meaning we can more easily browse cpu-based metrics. Selecting a tag also filters subsequent tags. The number of tags to select shrinks from 3 to 2, meaning the tag key host is the only other valid tag to exist alongside cpu:
You’re not limited to picking one tag either. You’re free to keep selecting tags and Chronograf will continue to make smart decisions about what subsequent measurements and tags are still valid to explore.
In Closing
And that’s it! Chronograf is still under active development and we’d love to hear any and all feedback. Send the team an email at [email protected].
