Get Started with the TIG Stack and InfluxDB Core
By
Anais Dotis-Georgiou
Developer
Jan 24, 2025
Navigate to:
Note: This blog was written for InfluxDB 3 Core and Enterprise Alphas. Please check the documentation as there might be slight changes in its current version, Beta.
Time series data is everywhere—from IoT sensors and server metrics to financial transactions and user behavior. To collect, store, and analyze this data efficiently, you need tools purpose-built for the job. That’s where the TIG Stack comes in: Telegraf for data collection, InfluxDB for storage and analytics, and Grafana for visualization. Together, these tools offer a powerful solution for real-time analytics, observability, and monitoring.
At the heart of the TIG Stack is InfluxDB, a database platform specifically designed to collect, process, transform, and store time series data. InfluxDB is widely used for applications requiring real-time monitoring, lightning-fast queries, and interactive dashboards—whether you’re tracking IoT sensor data, monitoring server performance, analyzing financial markets, or ensuring network reliability.
The latest version, InfluxDB Core, introduces significant improvements in performance, usability, and cost-efficiency. These enhancements make it easier than ever to handle high-volume time series data and deliver real-time insights.
In this blog post, you’ll learn how to get started with the TIG Stack. We’ll guide you through:
- Writing data to InfluxDB 3 Core with Telegraf
- Visualizing your data with Grafana
Requirements
You’ll need to meet the following requirements to run this tutorial yourself. Please install the following software (or use Grafana Cloud):
- Telegraf
- InfluxDB Core
- Grafana: for example, if you’re on MacOS using homebrew, you can use
brew install grafanaandbrew services start grafana. Grafana will now be available on http://localhost:3000/.
Get InfluxDB up and running
After installing InfluxDB 3 Core, run the following command to start a server:
influxdb3 serve --host-id=local01 --object-store file --data-dir ~/.influxdb3Next generate a token with:
influxdb3 create tokenYou should see the following output:
Token: apiv3_xxx
Hashed Token: zzz
Start the server with `influxdb3 serve --bearer-token zzz`
HTTP requests require the following header: "Authorization: Bearer apiv3_xxx"
This will grant you access to every HTTP endpoint or deny it otherwise.
Now, we can use the plain Token with Telegraf. The Hashed Token is a cryptographic representation of the plain token. By passing the hashed token to the server, you avoid exposing the plain token in the command line, logs, or configuration files. So when a client sends a plain bearer token in an HTTP request, the server hashes the received token and compares the hashed result to the hashed token you provided at startup. This ensures that the server can validate the plain token securely storing or processing it directly.
Writing data to InfluxDB v3 OSS with Telegraf
First, you’ll need to install Telegraf on your machine. Review the requirements, download, and installation guide to get started. Once Telegraf is installed on your machine, we can create a configuration to write data to our InfluxDB instance. However, before diving into the configuration, let’s briefly discuss what Telegraf is and why its configuration is essential.
Telegraf is a lightweight, open-source server agent for collecting, processing, and sending metrics and events from various sources to a data store like InfluxDB. It works by using plugins that define what data to gather (inputs), how to process it (processors), and where to send it (outputs).
The Telegraf configuration file plays a central role in this process. It specifies which plugins to use, sets parameters like authentication credentials, and defines the data flow. Without a proper configuration file, Telegraf wouldn’t know:
- Where to collect the data from (e.g., a database, MQTT, system metrics)
- How to process or transform the data (optional)
- Where to send the data (in this case, to InfluxDB v3 OSS).
With Telegraf installed, you can use the following configuration to write data to your InfluxDB instance. This example sets up Telegraf to send system CPU metrics to InfluxDB v3 using the CPU Input Plugin and the InfluxDB v2 Output Plugin (the HTTP API endpoints are the same for v2 as they are for v3). Here’s what our configuration would look like:
# Global configuration
[agent]
  interval = "10s"           # Collection interval
  flush_interval = "10s"     # Data flush interval
# Input Plugin: CPU Metrics
[[inputs.cpu]]
  percpu = true              # Collect per-CPU metrics
  totalcpu = true            # Collect total CPU metrics
  collect_cpu_time = false   # Do not collect CPU time metrics
  report_active = true       # Report active CPU percentage
# Output Plugin: InfluxDB v2
[[outputs.influxdb_v2]]
  urls = ["http://127.0.0.1:8181"]
  token = "your plain Token apiv3_xxx"
  organization = ""
bucket = "cpu"Note: You don’t need to provide an Organization ID with InfluxDB Core
Now, we can run Telegraf with the following:
telegraf --config pwd/telegraf.conf --debugThe output helps us verify that we are successfully writing data with the following Telegraf logs:
2025-01-09T23:34:02Z I! Loading config: ./telegraf.conf
2025-01-09T23:34:02Z I! Starting Telegraf 1.26.2
2025-01-09T23:34:02Z I! Available plugins: 235 inputs, 9 aggregators, 27 processors, 22 parsers, 57 outputs, 2 secret-stores
2025-01-09T23:34:02Z I! Loaded inputs: cpu
2025-01-09T23:34:02Z I! Loaded aggregators:
2025-01-09T23:34:02Z I! Loaded processors:
2025-01-09T23:34:02Z I! Loaded secretstores:
2025-01-09T23:34:02Z I! Loaded outputs: influxdb_v2
2025-01-09T23:34:02Z I! Tags enabled: host=MacBook-Pro-4.local
2025-01-09T23:34:02Z I! [agent] Config: Interval:10s, Quiet:false, Hostname:"MacBook-Pro-4.local", Flush Interval:10s
2025-01-09T23:34:02Z D! [agent] Initializing plugins
2025-01-09T23:34:02Z D! [agent] Connecting outputs
2025-01-09T23:34:02Z D! [agent] Attempting connection to [outputs.influxdb_v2]
2025-01-09T23:34:02Z D! [agent] Successfully connected to outputs.influxdb_v2
2025-01-09T23:34:02Z D! [agent] Starting service inputs
2025-01-09T23:34:12Z D! [outputs.influxdb_v2] Buffer fullness: 0 / 10000 metrics
2025-01-09T23:34:23Z D! [outputs.influxdb_v2] Wrote batch of 13 metrics in 792.507791ms
Verifying a successful write with the InfluxDB CLI
If you want to, you can now verify that we are successfully writing CPU metrics to InfluxDB v3 OSS with the following CLI command:
influxdb3 query --database=cpu "SELECT * FROM cpu LIMIT 10"Configuring the Grafana source
To configure InfluxDB Core as a new source in Grafana visit http://localhost:3000/
and navigate to connections > datasources > new > search and select for InfluxDB. Select SQL as the language type. Then provide the following credentials in the configuration:
- URL: http://localhost:8181
- Database: cpu
- Insecure Connection: toggle on
Hit Save&Test to verify that you can connect to InfluxDB Core.
 Now, you can make visualizations and add them to your dashboards as you usually would in Grafana by navigating to Dashboards > +Create Dashboard > +Add Visualization > Select Datasource > influxdb. And using the Builder to generate a SQL query for you. For example, the Builder generated the following code and visualization:
SELECT "cpu", "usage_user", "time" FROM "cpu" WHERE "time" >= $__timeFrom AND "time" <= $__timeTo AND "cpu" = 'cpu0'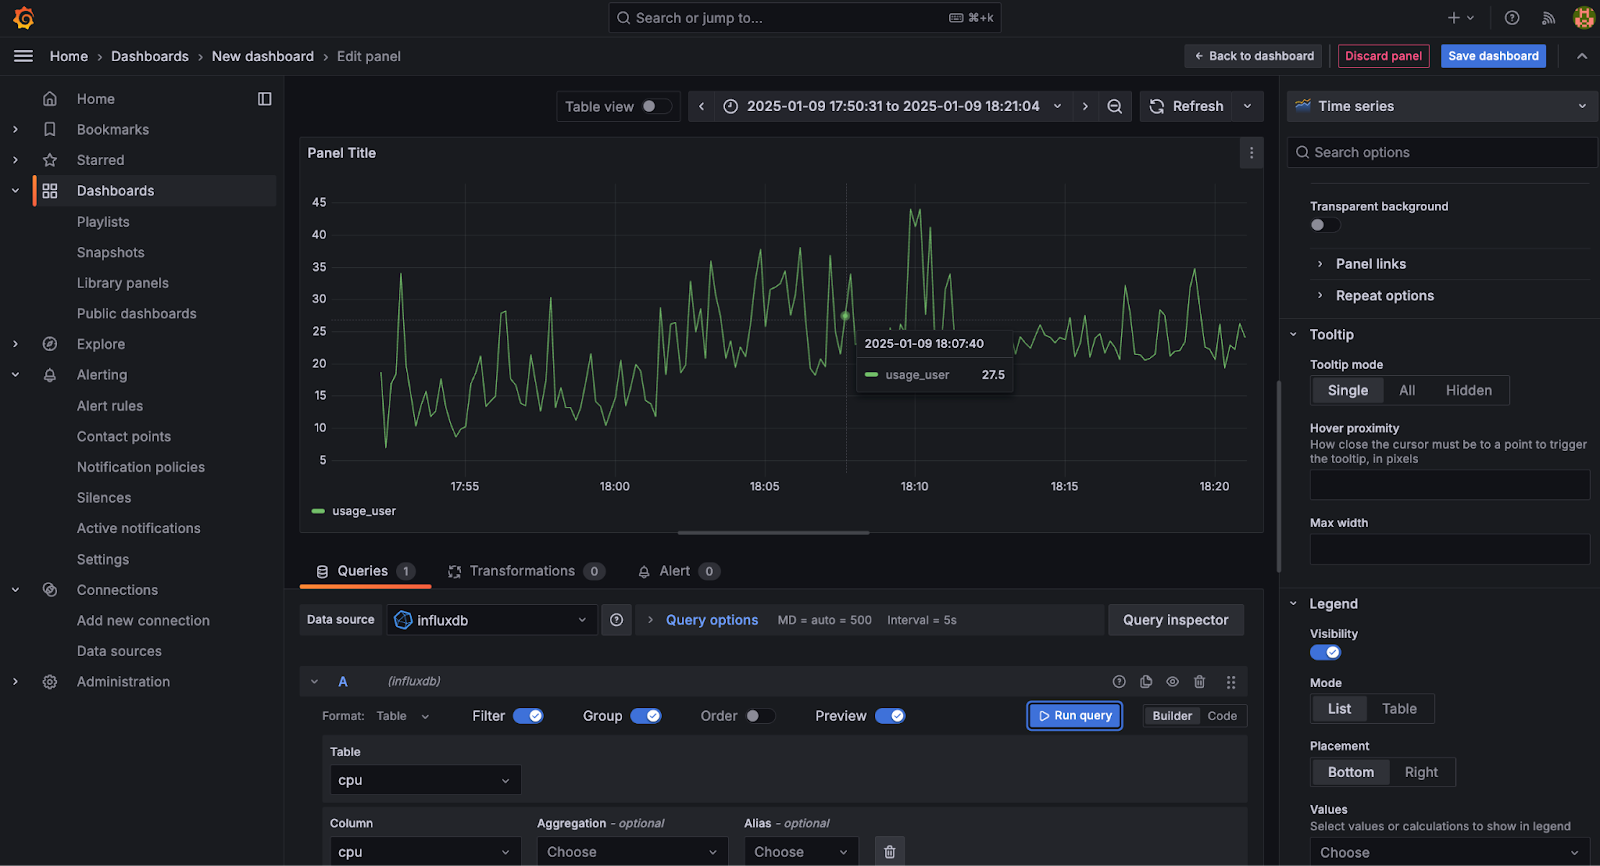

Final thoughts
I hope this blog post helps you get started using InfluxDB Core, Telegraf, and Grafana. If you have any feedback about InfluxDB Core, we’d love to hear it in the #influxdb3_core channel on Discord. Your experience and opinion are important to us during the Alpha release of InfluxDB Core. Get started with InfluxDB v3 Cloud here. If you need help, please get in touch with us us on our community site or Slack channel. If you are also working on a data processing project with InfluxDB, I’d love to hear from you!
