Part One: Setting Up InfluxDB 3.0 and Visualizing Data
By
Neha Julka /
Developer
Oct 15, 2024
Navigate to:
After reading this guide, you’ll have a fully functional real-time data intelligence system. We’ll do the full build, including adding a database, without ever having to manage the complexities of the database server.
Introduction
InfluxDB is a powerful time series platform designed to manage and analyze time-stamped data. This blog post will focus on InfluxDB Cloud Serverless, a fully managed, scalable, and usage-based version of InfluxDB. Cloud Serverless eliminates the need for infrastructure management, allowing you to focus solely on storing and analyzing your time series data. InfluxDB Cloud Serverless is ideal for personal projects, IoT, and real-time analytics, especially when you want to deploy quickly without worrying about scaling or server maintenance.
My inspiration for this blog is another project, also created with InfluxDB, the two-part series PID Controllers and InfluxDB. This project uses Kafka and other tools to model a continuous stirred-tank reactor (CSTR) with a PID controller for real-time data visualization and control. Following that post, I applied similar principles in a simpler home project setting using InfluxDB Cloud Serverless.
Prerequisites
Before diving into the setup, let’s review what you’ll need for setting up InfluxDB Cloud Serverless.
Software Requirements:
To get started, you’ll need to download and install a few software packages:
- InfluxDB Cloud Serverless: This usage-based, managed service allows you to store and query time series data without worrying about scaling or server infrastructure. With Cloud Serverless, you pay only for what you use, making it an excellent choice for home projects and experiments.
- macOS: Since this is a home project, I’ll be working on macOS to interact with InfluxDB Cloud Serverless via the CLI, the InfluxDB UI, and APIs.
- Visualization Tool (Grafana): Grafana is a popular, open source tool for visualizing your time series data.
- Telegraf: Telegraf is an open source data collection agent that collects and sends metrics to InfluxDB Cloud Serverless. It can gather system metrics or IoT data and send them to InfluxDB with minimal setup, making it a great addition to this project.
Hardware Requirements:
- Internet Connection: Since InfluxDB Cloud Serverless operates in the cloud, a stable internet connection is crucial to accessing your database, interacting with the platform, and ingesting or querying data.
- Local Machine (macOS): You won’t need significant local resources as the database runs entirely in the cloud. A basic macOS setup with access to the terminal and web browser is sufficient to interact with the InfluxDB UI and CLI.
Setting up InfluxDB
This section covers the steps for setting up InfluxDB Cloud Serverless on macOS.
InfluxDB Cloud Serverless is cloud-based and does not require local software installation. The setup involves creating an account, setting up a data bucket, generating API tokens for secure access, and optionally configuring the InfluxDB CLI for command-line interactions. The configuration section below includes tips for optimizing time series data management, such as defining retention policies and structuring the schema for efficient querying and performance.
Installation Guide
- Sign up for InfluxDB Cloud Serverless:
- Head over to the InfluxDB Cloud sign-up page.
- InfluxDB Cloud Serverless offers a free tier, perfect for this home project.
- Follow the prompts to set up your account, and once inside, you’ll be taken to the InfluxDB UI.
- Create a bucket:
- Buckets are where InfluxDB stores time series data. To create one:
- Go to Data > Buckets in the sidebar.
- Click Create Bucket, name the bucket (e.g., “HomeProjectData”), and define the retention period. For most home projects, you can set a longer retention period, like 30 days.
- Buckets are where InfluxDB stores time series data. To create one:
- Generate API tokens:
- To interact with InfluxDB via CLI or other tools, you’ll need an API token.
- Go to Data > Tokens and click Generate API Token.
- Select the All-Access Token or Write Token, depending on your use case.
- To interact with InfluxDB via CLI or other tools, you’ll need an API token.
- Install the InfluxDB CLI (optional):
- While the UI is great for interacting with your data, you may want to use the command line. The following code lines will install the InfluxDB CLI.
- The CLI lets you specify connection configuration presets that let you store and quickly switch between multiple sets of InfluxDB connection credentials:
influx config create --config-name default \
    --host-url https://us-east-1-1.aws.cloud2.influxdata.com \
    --org "your_organization_name" \
    --token "your_api_token" \
    --active
Configuration
InfluxDB Cloud Serverless automatically handles scaling and maintenance, and configuring a few key settings will further optimize storage and queries.
- Retention Policy:
- Set an appropriate retention period to ensure that data is stored only as long as necessary. For home projects, this could be 30 days or longer depending on your needs.
- Precision and Timestamps:
- Accurate timestamps benefit time series data. Ensure your data writes are precise, down to the millisecond or nanosecond level if necessary.
influx write --bucket "HomeProjectData" --precision s 'weather,location=home temperature=72.3 1672531190' - Schema Design:
- InfluxDB adapts to the incoming data structure as it is written with its schema-on-write. You can optimize performance by designing your schema in the following ways:
- Use tags for metadata (e.g., location, device ID) that you’ll frequently query.
- Store fields for data that changes (e.g., temperature, CPU usage).
By following these steps, you’ll have a fully functional InfluxDB Cloud Serverless setup optimized for storing and querying your time series data. The next step involves ingesting data into your database and preparing it for visualization and analysis.
Ingesting data
Once InfluxDB Cloud Serverless is set up, the next step is getting data into the database. This involves writing time series data using line protocol, an efficient text-based format designed for InfluxDB.
Writing Data to InfluxDB
The line protocol is a simple format that enables efficient data ingestion into InfluxDB. It contains the following components:
- Measurement: Defines what is measured (e.g., “weather”).
- Tags: Key-value pairs used to categorize the data (e.g., “location=home”).
- Fields: The actual values measured (e.g., “temperature=72.3”).
- Timestamp: Time the measurement occurred (e.g., “1672531190”).
Here’s an example of writing a single data point into InfluxDB using the CLI:
influx write --bucket "HomeProjectData" --precision s 'weather,location=home temperature=72.3 1672531190'
This command writes a temperature measurement tagged with location=home into the HomeProjectData bucket. The timestamp is represented in seconds since epoch.
Writing Data Using Telegraf
Automating data ingestion using Telegraf will collect various metrics and forward them to InfluxDB. This is especially useful for scenarios like server monitoring or IoT systems.
A detailed guide on using Telegraf with InfluxDB for the CSTR project involving PID controllers can be found in the second part of the blog series, PID Controllers and InfluxDB Part Two. This blog post walks through setting up Telegraf to write data, specifically for controlling and monitoring a continuous stirred-tank reactor (CSTR).
For the full code used in that example, including Telegraf configurations, check out the code repository here.
Leveraging Telegraf will automate the ingestion of various data points into InfluxDB, whether you’re monitoring a home project or large-scale systems.
Downsampling: What It Is and Why It’s Needed
In high-frequency time series applications, large volumes of raw data can quickly overwhelm a database. This leads to performance issues and excessive storage consumption. Downsampling is the process of reducing data resolution by summarizing it over larger intervals, such as converting second-by-second data into one-minute averages. This method helps manage long-term data storage while retaining valuable trends.
For example, a temperature sensor might collect data every second, but you can downsample it to store only one-minute averages over time. Downsampling allows you to keep a clear picture of temperature trends without the need for every single data point, thus reducing storage and query overhead.
While downsampling is an effective way to manage large datasets, it is an advanced feature that may not be necessary for smaller-scale projects or those with manageable data ingestion rates. For projects with high-frequency data, downsampling can optimize storage and query performance, but if you’re working on a smaller scale, this step can be skipped. Downsampling is particularly useful for reducing data resolution over time and is commonly used in larger, more complex systems.
How Quix.io Helps with Downsampling
Quix.io, a real-time streaming platform, can assist in downsampling by handling data transformations and aggregations before sending the data to InfluxDB. By integrating Quix.io, real-time data streams can be processed and downsampled on-the-fly, which lightens the load on InfluxDB. This is particularly helpful for use cases where high-frequency data needs to be ingested and processed quickly.
The blog post Quix Community Plugins for InfluxDB explains how Quix.io integrates with InfluxDB to handle streaming tasks like data downsampling, providing a scalable and efficient way to manage real-time data.
Using Quix.io, complex operations like downsampling can be performed upstream, ensuring that only the most relevant and aggregated data reaches InfluxDB. This allows for efficient long-term storage and faster queries while maintaining critical insights from high-frequency data streams.
Visualizing the data
Data visualization is essential for interpreting time series data effectively. InfluxDB provides built-in visualization tools within its user interface, allowing users to explore and analyze data directly. External tools like Grafana are another option for visualizing data, offering additional flexibility and customization for more complex dashboards.
This section will first cover how to use InfluxDB’s native visualization features and then explain how to set up and utilize Grafana for enhanced data visualization.
Using the UI to Visualize Data
InfluxDB’s UI offers powerful features to visualize and interact with your data directly. Here’s how to make the most of it:
Accessing the Data Explorer
- Log In to InfluxDB Cloud UI:
- Navigate to your InfluxDB Cloud Serverless account and sign in.
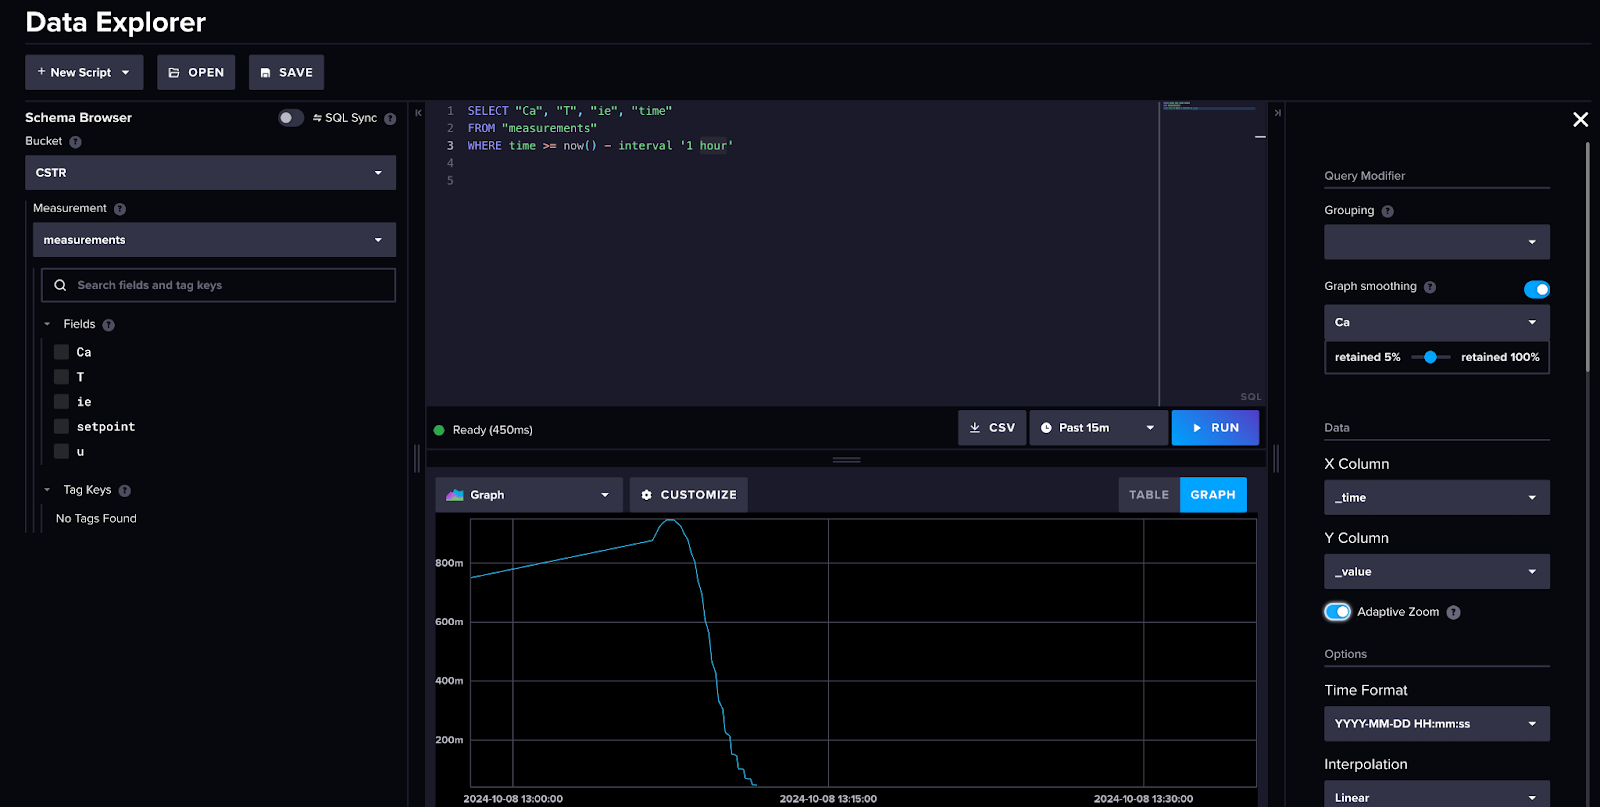
- Open the Data Explorer:
- From the left-hand menu, select “Data Explorer.” This is the primary interface for querying and visualizing data within InfluxDB.
Querying and Visualizing Data
- Select the Appropriate Bucket:
- Ensure the correct bucket (e.g., “HomeProjectData”) is selected from the dropdown menu.
- Build a Query Using the Query Builder:
- Filter by Measurement:
- Click on “Filter” and select the measurement you wish to visualize (e.g., “weather”).
- Filter by Fields:
- Choose the specific fields to include (e.g., “temperature”, “humidity”).
- Filter by Tags:
- Apply any necessary tag filters to narrow down the data (e.g., “location = home”).
- Filter by Measurement:
- Set the Time Range:
- Adjust the time range selector at the top of the screen to specify the period you want to view data (e.g., last 24 hours, last seven days).
- Visualize the Data:
- The data will automatically display in a graph below the query builder.
- Change Visualization Type:
- Click on the “Visualization” tab.
- Select the desired visualization type (e.g., Line Graph, Bar Chart, Gauge).
- Customize the Visualization:
- Modify visualization properties such as axis labels, colors, legends, and thresholds to enhance readability and insight.
Using Grafana for Advanced Visualization
Grafana is a popular dashboarding choice because of its customization capabilities and rich features. Integrating Grafana with InfluxDB allows for seamless data exploration and visualization, providing users with detailed, interactive dashboards in their workflows.
Installation and Configuration of Grafana
Installing Grafana on macOS:
- Download Grafana:
- Visit the Grafana Download Page and select the macOS installer.
- Install Grafana:
- Run the downloaded installer and follow the on-screen instructions to complete the installation.
- Start Grafana:
Open the Terminal and start the Grafana server:brew services start grafana- Note: If Grafana was installed via Homebrew, it can be started using the above command provided. If installed using the macOS package, Grafana can be started from the Applications folder or via command line using the appropriate start script.
- Access the Grafana UI:
- Open a web browser and navigate to
http://localhost:3000. - Log in using the default credentials:
- Username:
admin - Password:
admin
- Username:
- You will be prompted to set a new password upon first login.
- Open a web browser and navigate to
Connecting Grafana to InfluxDB Cloud Serverless
- Add InfluxDB as a Data Source:
- In Grafana, click on the “Gear” icon (Configuration) in the left-hand menu and select “Data Sources”.
- Click “Add data source” and choose “InfluxDB” from the list.
- Configure the InfluxDB Data Source:
- Query Language: Select Flux.
- URL: Enter the InfluxDB API URL, which can be found in your InfluxDB Cloud account. It typically looks like https://us-west-2-1.aws.cloud2.influxdata.com.
- Organization: Input your InfluxDB organization name.
- Authentication:
- Token: Paste the API token generated earlier from your InfluxDB account.
- TLS/SSL Settings:
- Ensure “With Credentials” is checked.
- Set “TLS Client Auth” and “Skip TLS Verify” according to your security requirements (usually left at default settings).
- Default Bucket:
- Specify the bucket to use by default (e.g., “HomeProjectData”).
- Click “Save & Test” to verify the connection. A successful message should confirm that Grafana is connected to InfluxDB.
Creating Dashboards in Grafana
- Create a New Dashboard:
- Click on the “Plus (+)” icon in the left-hand menu and select “Dashboard”.
- Click “Add new panel” to start creating a new visualization.
- Use Query Builder:
- In the Query Editor, select your InfluxDB data source.
- Use the Query Builder to choose measurements, fields, and filters for your data.
- Customize the Visualization:
- Choose the appropriate visualization type from the “Visualization” tab (e.g., Time Series, Gauge, Heatmap).
- Configure visualization settings such as titles, legends, axis, and color schemes to enhance the presentation of data.
- Apply and Save:
- After configuring your query and visualization, click “Apply” to add it to the dashboard.
- Save the dashboard for future use, assigning it a name that reflects its purpose.

Conclusion
InfluxDB Cloud Serverless provides a scalable, fully managed solution for handling time series data and eliminates manual infrastructure management. Cloud Serverless is ideal for projects of any size.
This post covered the setup of InfluxDB Cloud Serverless, including data ingestion, visualization, and alert configuration. The CSTR project with a PID controller was an example of how real-time data can be ingested using Telegraf into InfluxDB.
In the next post, we will explore InfluxDB 3.0 architecture, diving into how the database efficiently handles large-scale time series data processing and storage, providing enhanced performance for modern data-driven projects.
