Monitoring Kubernetes Architecture
By
Gianluca Arbezzano254
Product
Use Cases
Developer
Mar 19, 2018
Navigate to:
There are two important points you need to think about when monitoring a Kubernetes architecture. One is about the underlying resources, the bare metal Kubernetes is running on. The second is related to every service, ingress, and pod that you deployed. To have good visibility into your clusters you need to get metrics from both so that you can compare and reference these metrics. I am writing this article because at InfluxData, we are getting our hands dirty with Kubernetes and I think it is time to share some of the practices that we applied to our clusters to get your feedback (also because they are working pretty well). You should have a totally dedicated namespace for monitoring. We called it monitoring:
kubectl create namespace monitoringDo not deploy it on the default namespace. In general, the default namespace should be always empty. I am assuming that you are able to deploy InfluxDB and Chronograf on Kubernetes here, or this article will become an unreadable crappy YAML file.
Just a note about persistent volumes. InfluxDB, Kapacitor, and Chronograf store data on disk. This means that we need to be careful about how we manage them. Otherwise, our data will go away with the container. Kubernetes has a resource called Persistent Volume that helps you mount volumes based on where you are running your cluster. We are using AWS and we claim EBS volumes to manage /var/lib/influxdb and the other directories.
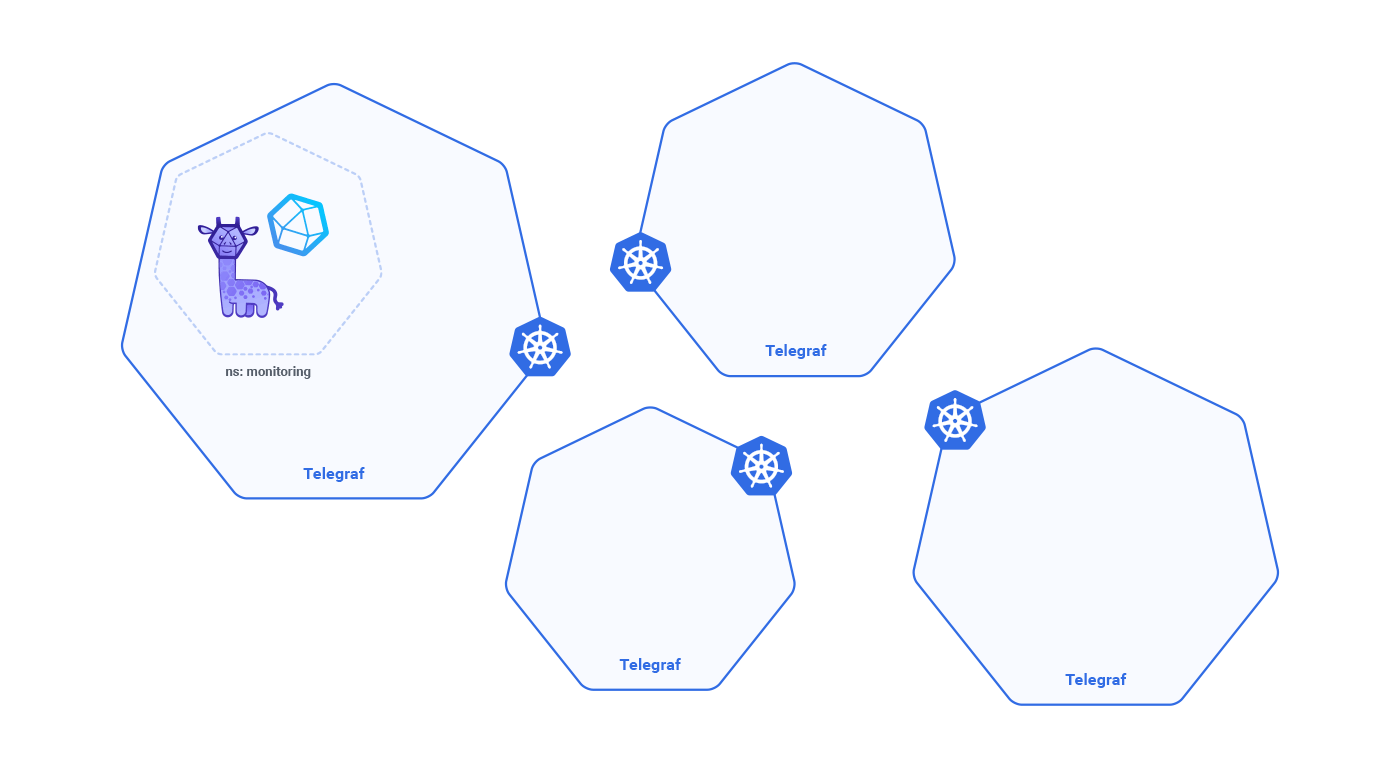
Now that you have your system running, we can use a DeamonSet to deploy Telegraf on every node. This Telegraf agent will take care of resources like iops, network, cpu, memory, disk and other services from the host. In order to do that, we need to share some directories from the host or Telegraf will end up monitoring the container instead of the host.

DaemonSet is a Kubernetes’ resource that distributes containers across all the nodes automatically. It’s very powerful if you need to deploy collectors for metrics or logs like we are doing now.
apiVersion: v1
kind: ConfigMap
metadata:
  name: telegraf
  namespace: monitoring
  labels:
    k8s-app: telegraf
data:
  telegraf.conf: |+
    [global_tags]
      env = "$ENV"
    [agent]
      hostname = "$HOSTNAME"
    [[outputs.influxdb]]
      urls = ["$MONITOR_HOST"] # required
      database = "$MONITOR_DATABASE" # required

      timeout = "5s"
      username = "$MONITOR_USERNAME"
      password = "$MONITOR_PASSWORD"

    [[inputs.cpu]]
      percpu = true
      totalcpu = true
      collect_cpu_time = false
      report_active = false
    [[inputs.disk]]
      ignore_fs = ["tmpfs", "devtmpfs", "devfs"]
    [[inputs.diskio]]
    [[inputs.kernel]]
    [[inputs.mem]]
    [[inputs.processes]]
    [[inputs.swap]]
    [[inputs.system]]
    [[inputs.docker]]
      endpoint = "unix:///var/run/docker.sock"
    [[inputs.kubernetes]]
      url = "http://1.1.1.1:10255"

---
# Section: Daemonset
apiVersion: apps/v1
kind: DaemonSet
metadata:
  name: telegraf
  namespace: monitoring
  labels:
    k8s-app: telegraf
spec:
  selector:
    matchLabels:
      name: telegraf
  template:
    metadata:
      labels:
        name: telegraf
    spec:
      containers:
      - name: telegraf
        image: docker.io/telegraf:1.5.2
        resources:
          limits:
            memory: 500Mi
          requests:
            cpu: 500m
            memory: 500Mi
        env:
        - name: HOSTNAME
          valueFrom:
            fieldRef:
              fieldPath: spec.nodeName
        - name: "HOST_PROC"
          value: "/rootfs/proc"
        - name: "HOST_SYS"
          value: "/rootfs/sys"
        - name: ENV
          valueFrom:
            secretKeyRef:
              name: telegraf
              key: env
        - name: MONITOR_USERNAME
          valueFrom:
            secretKeyRef:
              name: telegraf
              key: monitor_username
        - name: MONITOR_PASSWORD
          valueFrom:
            secretKeyRef:
              name: telegraf
              key: monitor_password
        - name: MONITOR_HOST
          valueFrom:
            secretKeyRef:
              name: telegraf
              key: monitor_host
        - name: MONITOR_DATABASE
          valueFrom:
            secretKeyRef:
              name: telegraf
              key: monitor_database
        volumeMounts:
        - name: sys
          mountPath: /rootfs/sys
          readOnly: true
        - name: docker
          mountPath: /var/run/docker.sock
          readOnly: true
        - name: proc
          mountPath: /rootfs/proc
          readOnly: true
        - name: docker-socket
          mountPath: /var/run/docker.sock
        - name: utmp
          mountPath: /var/run/utmp
          readOnly: true
        - name: config
          mountPath: /etc/telegraf
      terminationGracePeriodSeconds: 30
      volumes:
      - name: sys
        hostPath:
          path: /sys
      - name: docker-socket
        hostPath:
          path: /var/run/docker.sock
      - name: proc
        hostPath:
          path: /proc
      - name: utmp
        hostPath:
          path: /var/run/utmp
      - name: config
        configMap:
          name: telegraf
As you can see, there are some environment variables required by the config-map and Telegraf, so I used secret to inject them. To create it, run this command, replacing the options with your needs:
kubectl create secret -n monitoring generic telegraf --from-literal=env=prod --from-literal=monitor_username=youruser --from-literal=monitor_password=yourpassword --from-literal=monitor_host=https://your.influxdb.local --from-literal=monitor_database=yourdbThere is a parameter called env that is set on prod for this example. We set this variable on every instance of Telegraf and it identifies the cluster. If you replicate environments as we do, you can create the same dashboard on Chronograf and use template variables to switch between clusters.
Now if you did everything right, you will be able to see hosts and points stored on InfluxDB and Chronograf. This is just the first phase: we now have visibility into the hosts, but we don’t know anything about the services that we are running.
Telegraf Sidecar
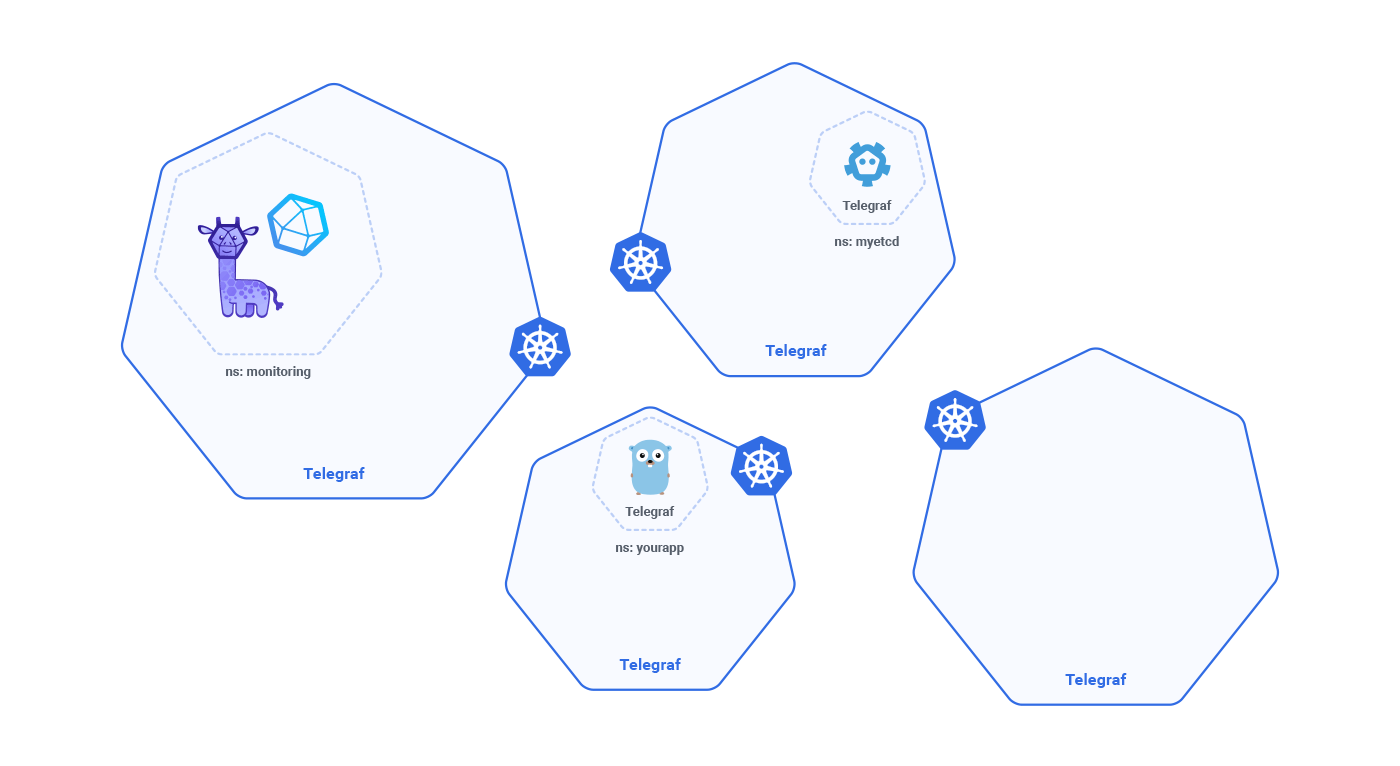
There are different ways to address this problem, but the one we are using is called sidecar. This term became popular recently in networking and routing mesh, but it’s similar to what we are doing.

Let’s assume that you need etcd because one of your applications uses it as storage. On k8s it will be StatefulSet like this:
apiVersion: v1
data:
  telegraf.conf: |+
    [global_tags]
      env = "$ENV"
    [[inputs.prometheus]]
      urls = ["http://localhost:2379/metrics"]
    [agent]
      hostname = "$HOSTNAME"
    [[outputs.influxdb]]
      urls = ["$MONITOR_HOST"]
      database = "mydb"
      write_consistency = "any"
      timeout = "5s"
      username = "$MONITOR_USERNAME"
      password = "$MONITOR_PASSWORD"
kind: ConfigMap
metadata:
  name: telegraf-etcd-config
  namespace: myapp
---
apiVersion: apps/v1beta1
kind: StatefulSet
metadata:
  namespace: "myapp"
  name: "etcd"
  labels:
    component: "etcd"
spec:
  serviceName: "etcd"
  # changing replicas value will require a manual etcdctl member remove/add
  # command (remove before decreasing and add after increasing)
  replicas: 3
  template:
    metadata:
      name: "etcd"
      labels:
        component: "etcd"
    spec:
      volumes:
        - name: telegraf-etcd-config
          configMap:
            name: telegraf-etcd-config
      containers:
      - name: "telegraf"
        image: "docker.io/library/telegraf:1.4"
        volumeMounts:
          - name: telegraf-etcd-config
            mountPath: /etc/telegraf
        env:
        - name: HOSTNAME
          valueFrom:
            fieldRef:
              fieldPath: spec.nodeName
        - name: MONITOR_HOST
          valueFrom:
            secretKeyRef:
              name: monitor
              key: monitor_host
        - name: MONITOR_USERNAME
          valueFrom:
            secretKeyRef:
              name: monitor
              key: monitor_username
        - name: MONITOR_PASSWORD
          valueFrom:
            secretKeyRef:
              name: monitor
              key: monitor_password
        - name: ENV
          valueFrom:
            secretKeyRef:
              name: monitor
              key: env
      - name: "etcd"
        image: "quay.io/coreos/etcd:v3.2.9"
        ports:
        - containerPort: 2379
          name: client
        - containerPort: 2380
          name: peer
        env:
        - name: CLUSTER_SIZE
          value: "3"
        - name: SET_NAME
          value: "etcd"
        command:
          - "/bin/sh"
          - "-ecx"
          - |
            IP=$(hostname -i)
            for i in $(seq 0 $((${CLUSTER_SIZE} - 1))); do
              while true; do
                echo "Waiting for ${SET_NAME}-${i}.${SET_NAME} to come up"
                ping -W 1 -c 1 ${SET_NAME}-${i}.${SET_NAME} > /dev/null && break
                sleep 1s
              done
            done
            PEERS=""
            for i in $(seq 0 $((${CLUSTER_SIZE} - 1))); do
                PEERS="${PEERS}${PEERS:+,}${SET_NAME}-${i}=http://${SET_NAME}-${i}.${SET_NAME}:2380"
            done
            # start etcd. If cluster is already initialized the `--initial-*` options will be ignored.
            exec etcd --name ${HOSTNAME} \
              --listen-peer-urls http://${IP}:2380 \
              --listen-client-urls http://${IP}:2379,http://127.0.0.1:2379 \
              --advertise-client-urls http://${HOSTNAME}.${SET_NAME}:2379 \
              --initial-advertise-peer-urls http://${HOSTNAME}.${SET_NAME}:2380 \
              --initial-cluster-token etcd-cluster-1 \
              --initial-cluster ${PEERS} \
              --initial-cluster-state new \
              --data-dir /var/run/etcd/default.etcd
As you can see, there is a lot more. There is a config map and there are two containers deployed under the same pod: etcd and Telegraf. Containers under the same pod share the network namespace, so resolving etcd from Telegraf is as easy as calling http://localhost:2379/metrics. etcd exposes Prometheus-like metrics and you can use the Telegraf input plugin to grab them.
apiVersion: v1
data:
  telegraf.conf: |+
    [global_tags]
      env = "$ENV"
    [[inputs.prometheus]]
      urls = ["http://localhost:2379/metrics"]
    [agent]
      hostname = "$HOSTNAME"
    [[outputs.influxdb]]
      urls = ["$MONITOR_HOST"]
      database = "mydb"
      write_consistency = "any"
      timeout = "5s"
      username = "$MONITOR_USERNAME"
      password = "$MONITOR_PASSWORD"
kind: ConfigMap
metadata:
  name: telegraf-etcd-config
  namespace: myapp
Let’s assume that your Go application pushes metrics to InfluxDB using our sdk. What you can do is to deploy on the same pod as we did for etcd a telegraf that uses the http listener input plugin. This plugin is powerful because it exposes a compatible InfluxDB http layer, and when you point your app to localhost:8086 you don’t need to change anythingyou will end up speaking with Telegraf without touching code.
Telegraf as a middleman between your app and InfluxDB is a plus because it will batch requests, optimizing network traffic and load on InfluxDB. Another optimization, although it requires a bit of code, is to move your application from tcp to udp. The sdk supports both methods, and you can use the socket_listener_plugin from Telegraf.
It means that your application will speak over upd to Telegraf and they share the network namespace, so packet loss will be minimized, your application will be faster, Telegraf will communicate the points over tcp to InfluxDB, and you can be sure that everything will land in InfluxDB. Bonus: If Telegraf goes down for some reason, your application won’t crash because udp doesn’t care! Your application will work as usual, but won’t store any points. If this scenario works for you, that’s great!
The benefit of using Telegraf as a sidecar to monitor distributed applications on Kubernetes is that the monitoring configuration for your services will be close to the application specification, so deployment is simple and sharing the same pod service discovery is easy, just like calling localhost.
This is usually a problem in this environment because if you have one collector, the containers change and you won’t know where they will be. Configuration can be tricky, but using this architecture, Telegraf will follow your application forever.
