Monitoring & Alerting in InfluxDB Cloud 2.0
By
Katy Farmer
updated December 14, 2025
Use Cases
Product
Developer
Navigate to:
We’re here to talk about monitoring and alerting in InfluxDB Cloud 2.0. We’re trying to make learning from your data easy, and in that spirit, we’re going to walk through setting up alerts and notifications in InfluxDB Cloud 2.0. It only takes a few minutes, but first, let’s talk about the fundamentals.
What are checks?
Basically, a check is a conditional. For example, if my donut level is 0, assign CRIT. If my battery level is below 25%, assign WARN. A check is formed by building a query that will assign a status (e.g., “CRIT”, “INFO”, etc.) based on specific conditions.

What are notifications?
Notifications are the way we find out about the checks our system is running. We receive notifications by configuring a notification endpoint (like Slack). When I receive a Slack message saying “Donut levels are CRITICAL”, that is a notification.
The process
Checks and notifications form alerting for InfluxDB Cloud 2.0, an essential part of the monitoring workflow. Now that we’ve passed the vocabulary test, let’s practice setting up checks and notifications. The following instructions assume you already have a data collector set up. If you don’t have a data collector yet, read this blog to get started. Once our system is successfully collecting data, it’s time to set up alerting.
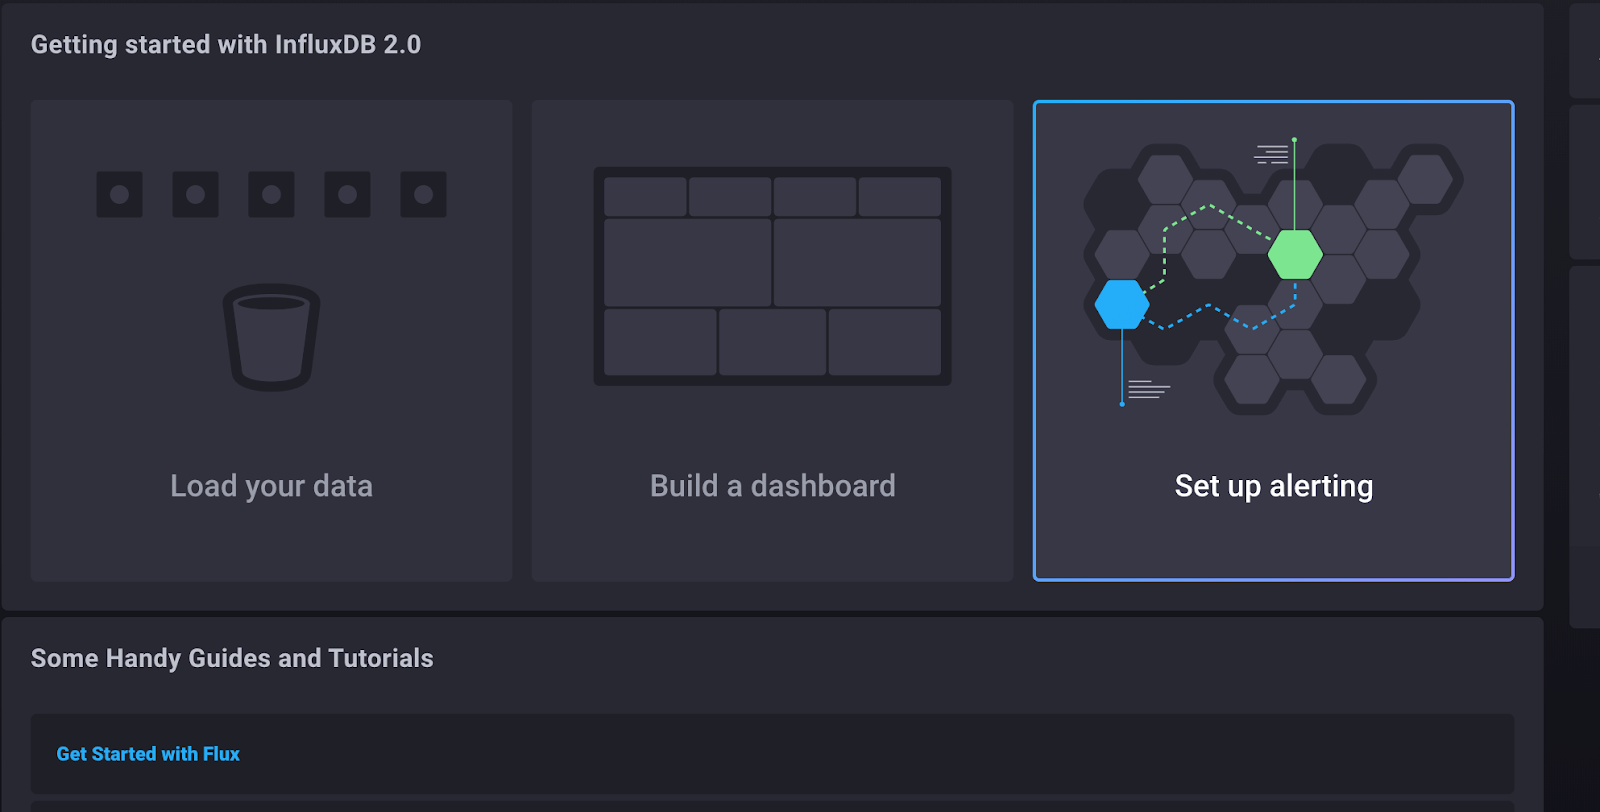
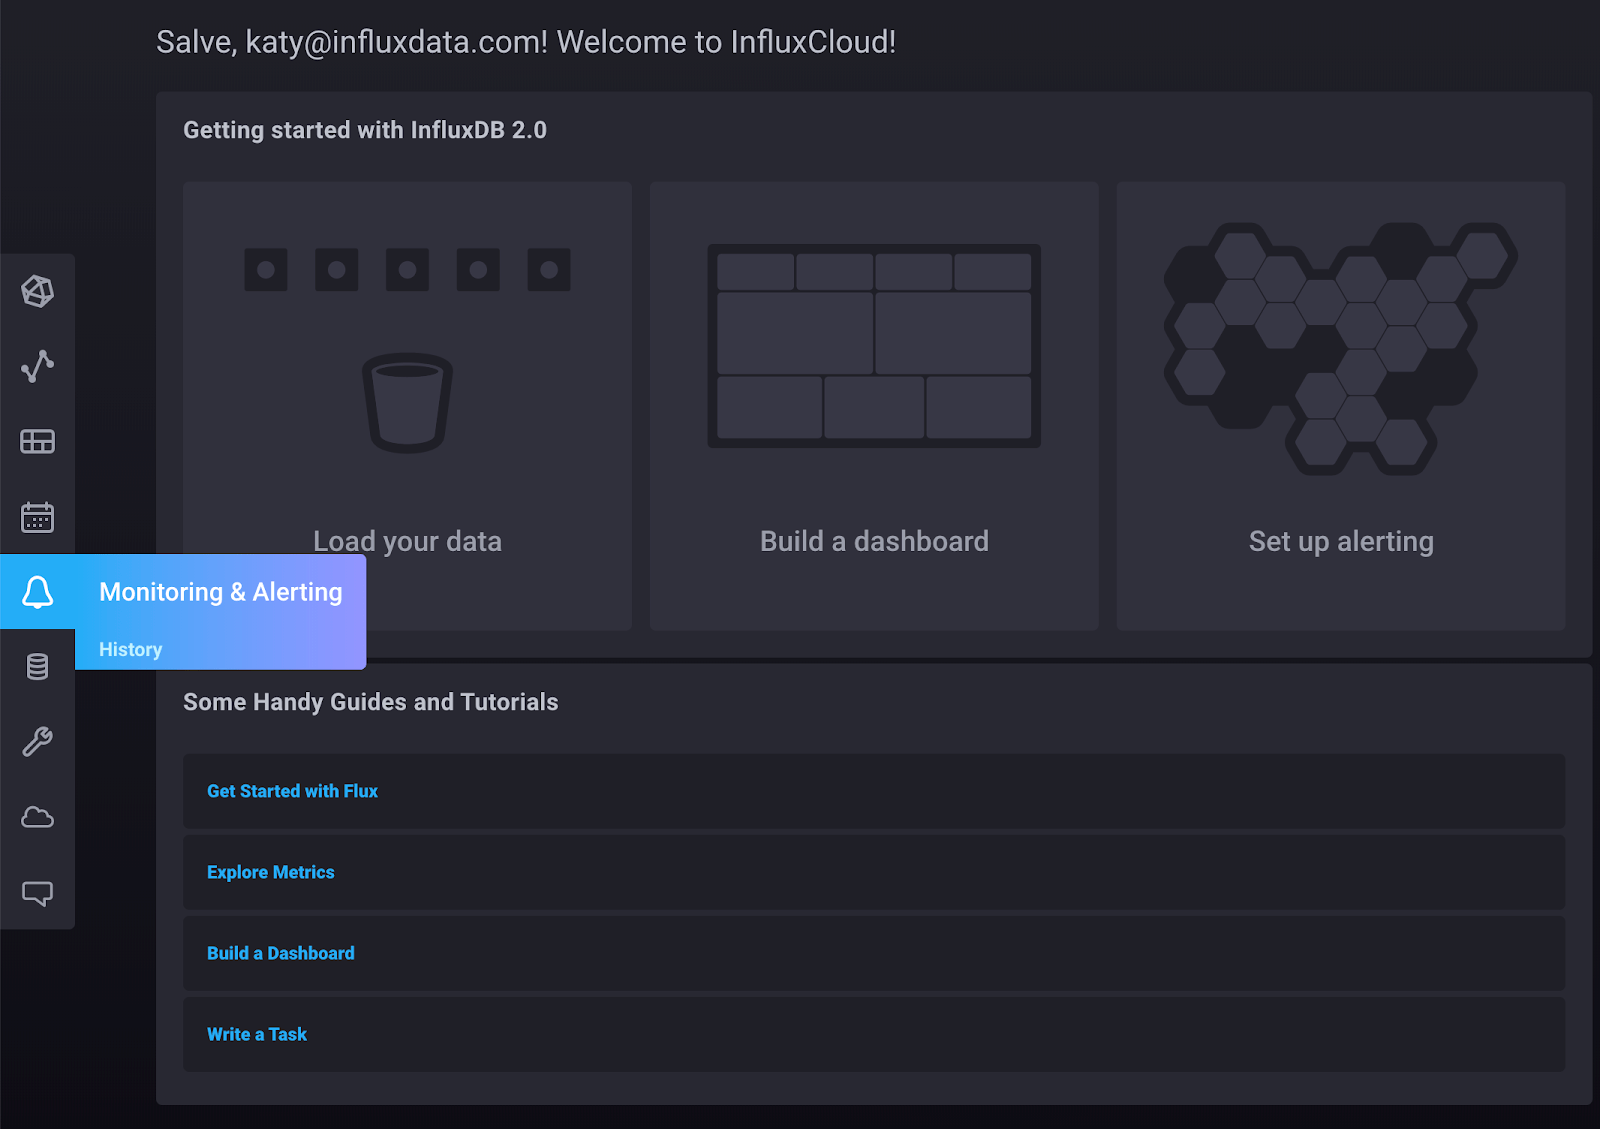
Use the “Set up alerting” graphic on your home tab to get started. This is a shortcut to the Monitoring & Alerting tab in the left-side navigation.
Create checks
InfluxDB Cloud knows we need a little help getting started, so go ahead and click the happy little Create a Check button.
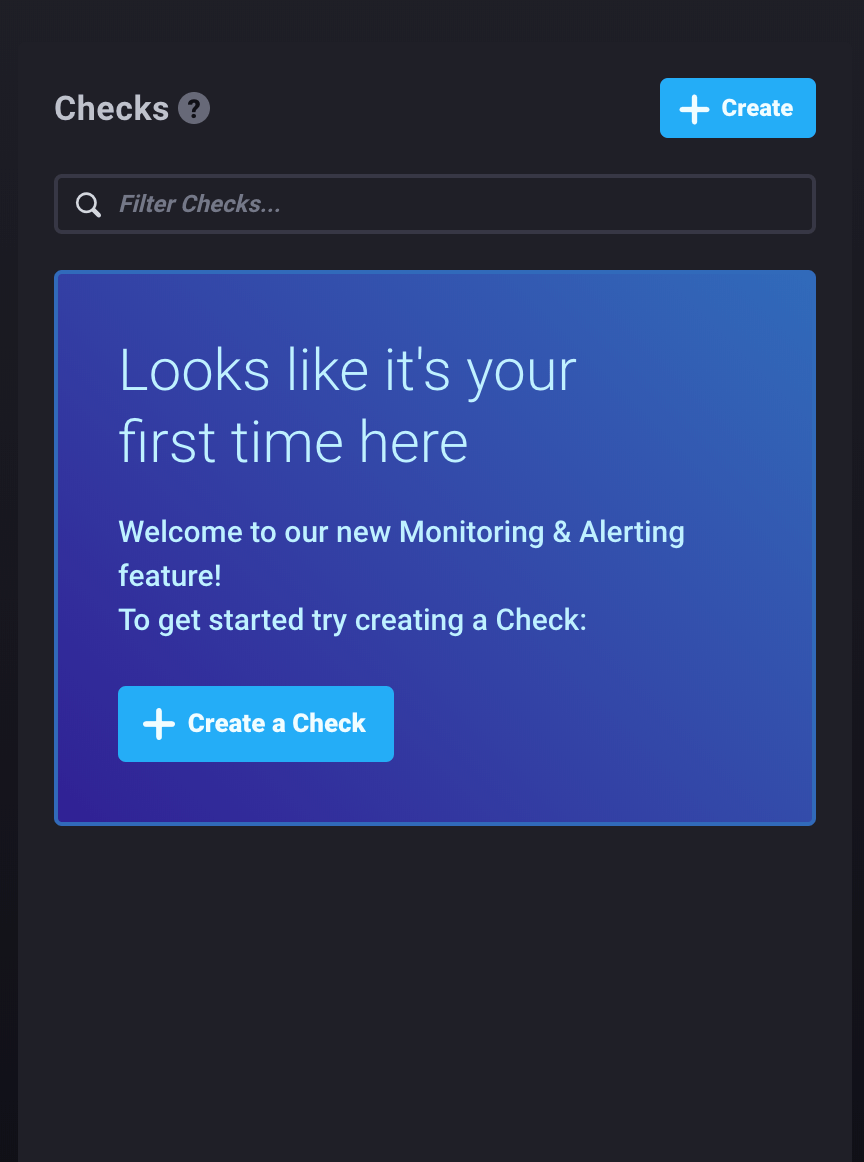
The page we see should look a lot like the Data Explorer; we’re using the same logic to build a query for our check.
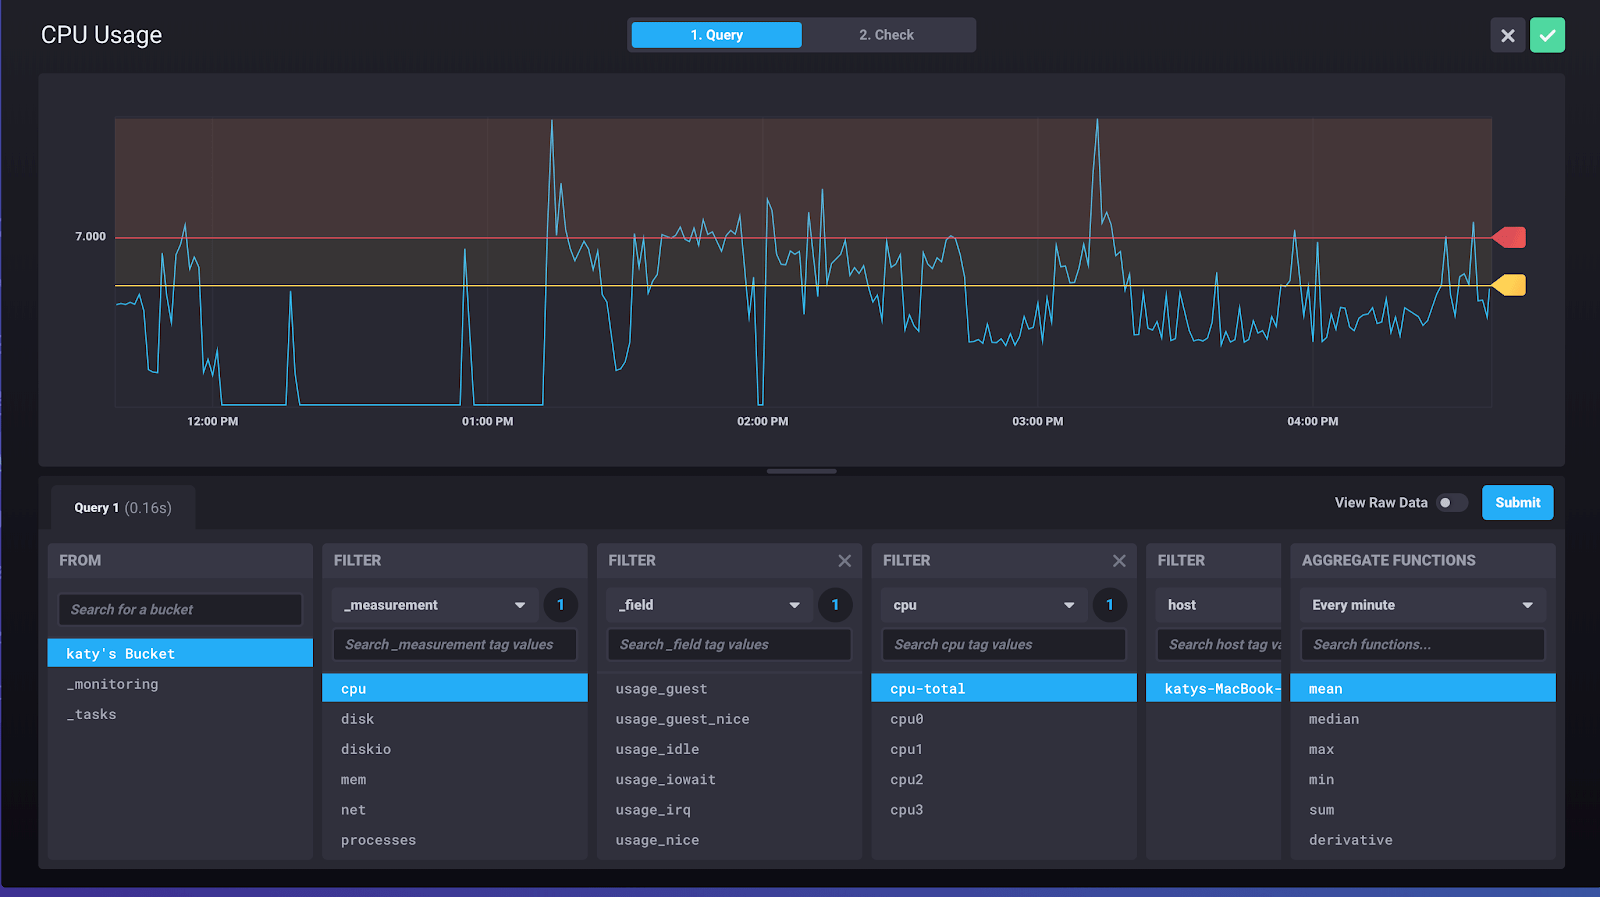
The first step is to build the query that will run inside the check. In the example above, we’re querying the average CPU usage of a particular host. Once you have your query, click 2. Check to finish the check.
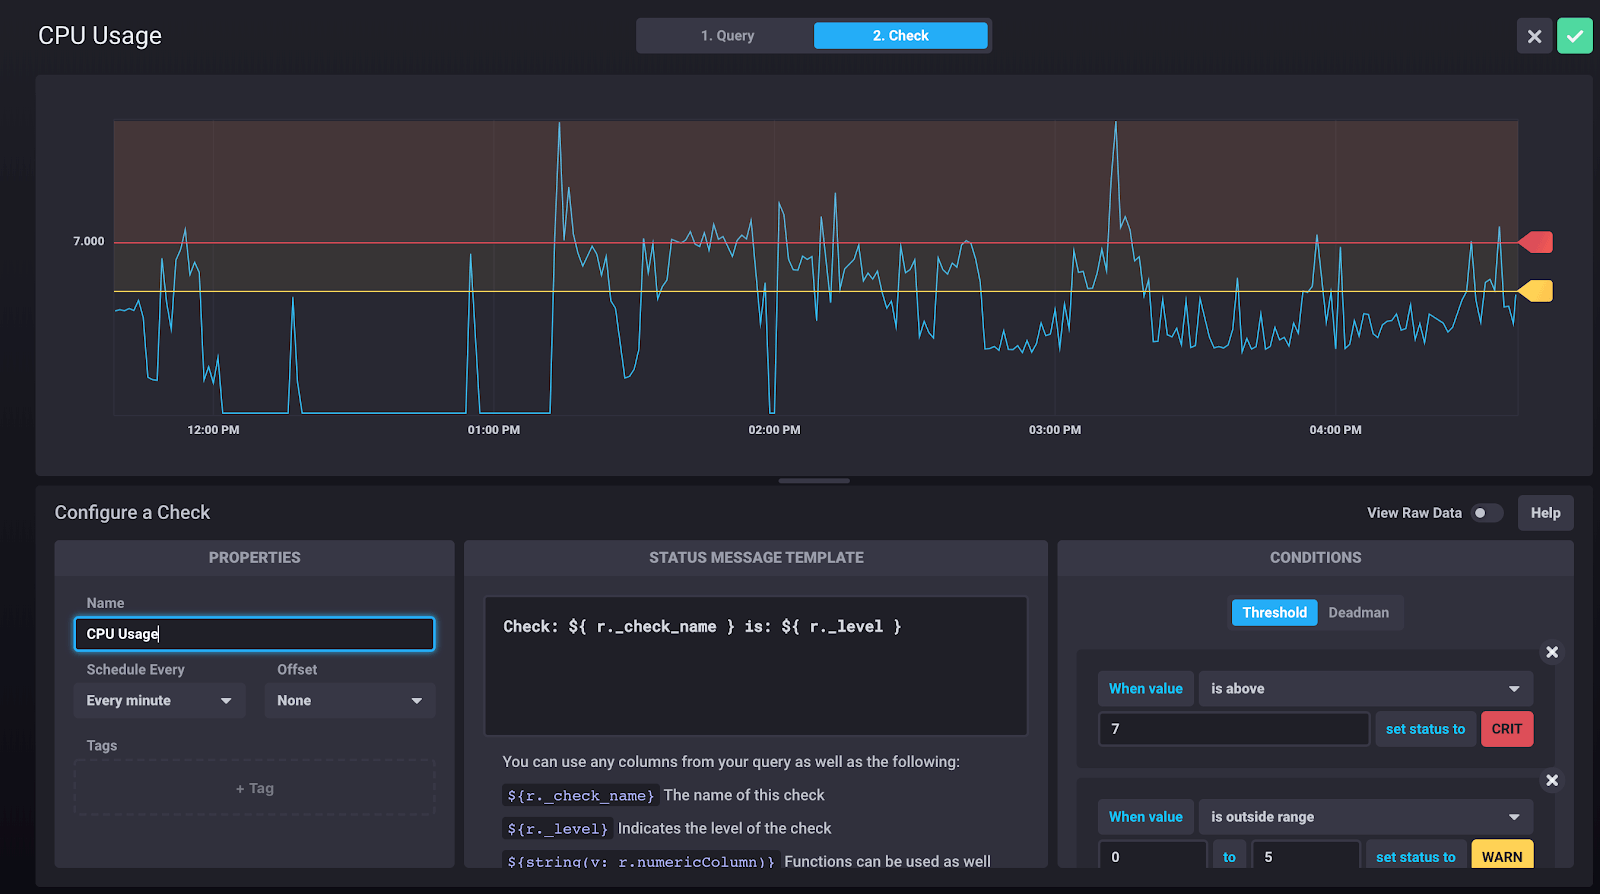
First, name the check. Just like variable names, go with something descriptive. The rule in the screenshot is called “CPU Usage”. I might name my other checks something equally simple like “Donut Inventory” or “Shark Tank Water Level”.
 <figcaption> Or Shark Tank Donut Inventory?</figcaption>
We also schedule the check here. If I’m gathering CPU data at 10-second intervals (like in the example shown), I might want to schedule a check for every 30 seconds to make sure I’m not missing very much data. If I’m monitoring my donut inventory, I probably only have to check every hour, as my donut intake is limited.
Now, we set the message we want to attach to the check. The message template can use string interpolation, so the text we see above: Check: ${ r._check_name } is: ${ r._level } would evaluate to something like Check: CPU Usage is WARN. Because we can use any of the columns from our query, we can be as specific as we want with this message.
The last step is to set the conditions. Let’s take a closer look at the menu.
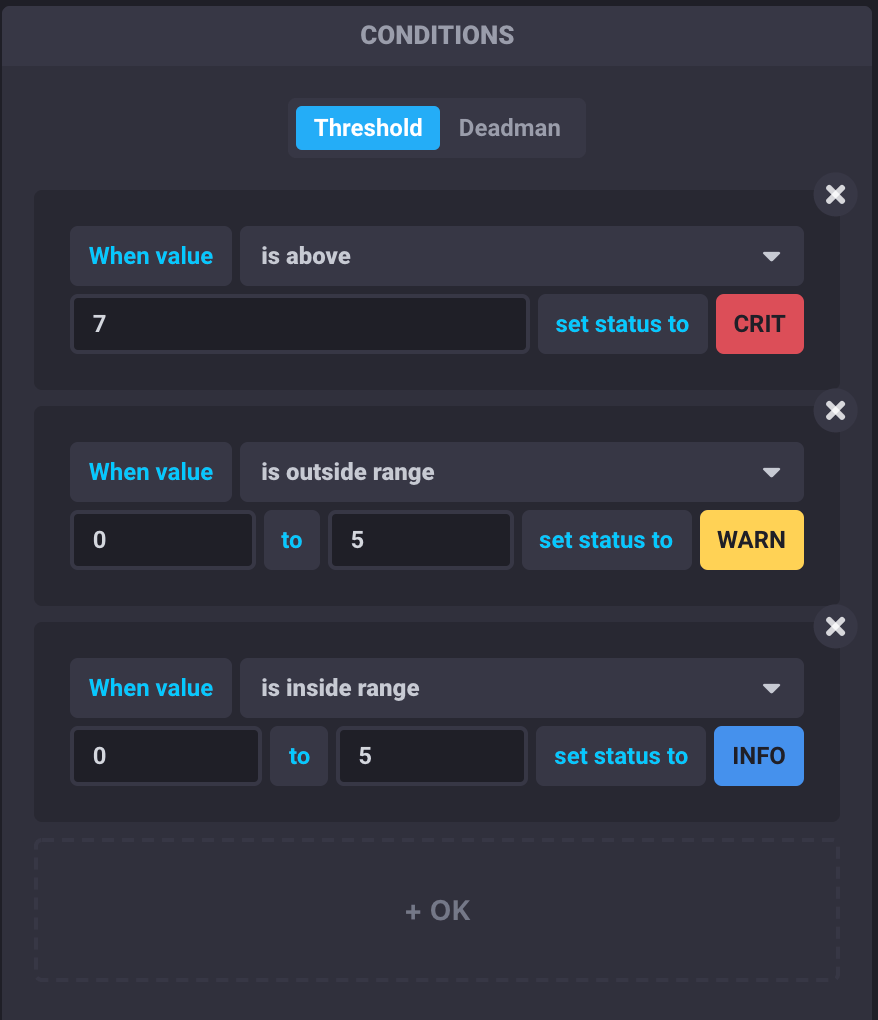
One of the best things about this setup is that we can adjust all of the values and conditions to see how often that condition is met in the current data. This helps us make sure that the status messages match the reality of our data. If my donut level is always CRIT, eventually I’ll stop taking it as seriously.
After you’ve set the query and the check, click that green checkmark in the top right because you’re done!
All checks will show in the Monitoring & Alerting tab with a toggle switch so that it’s easy to enable/disable.
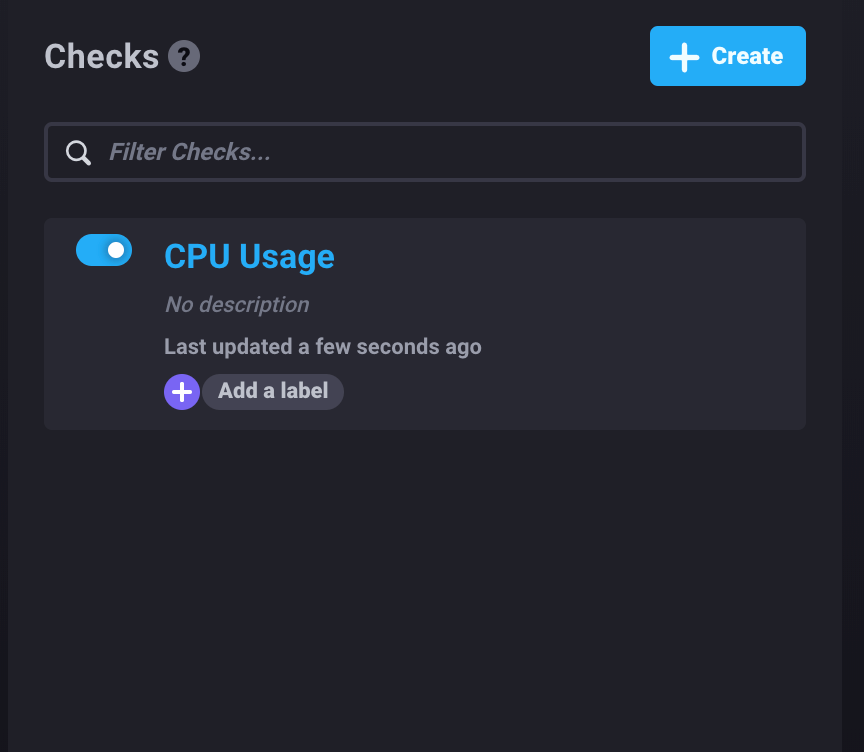
If you’re like me, you want a little assurance that your check is working. Hover over your check and select View History.

This will display a list of all results of the check, regardless of the status level.
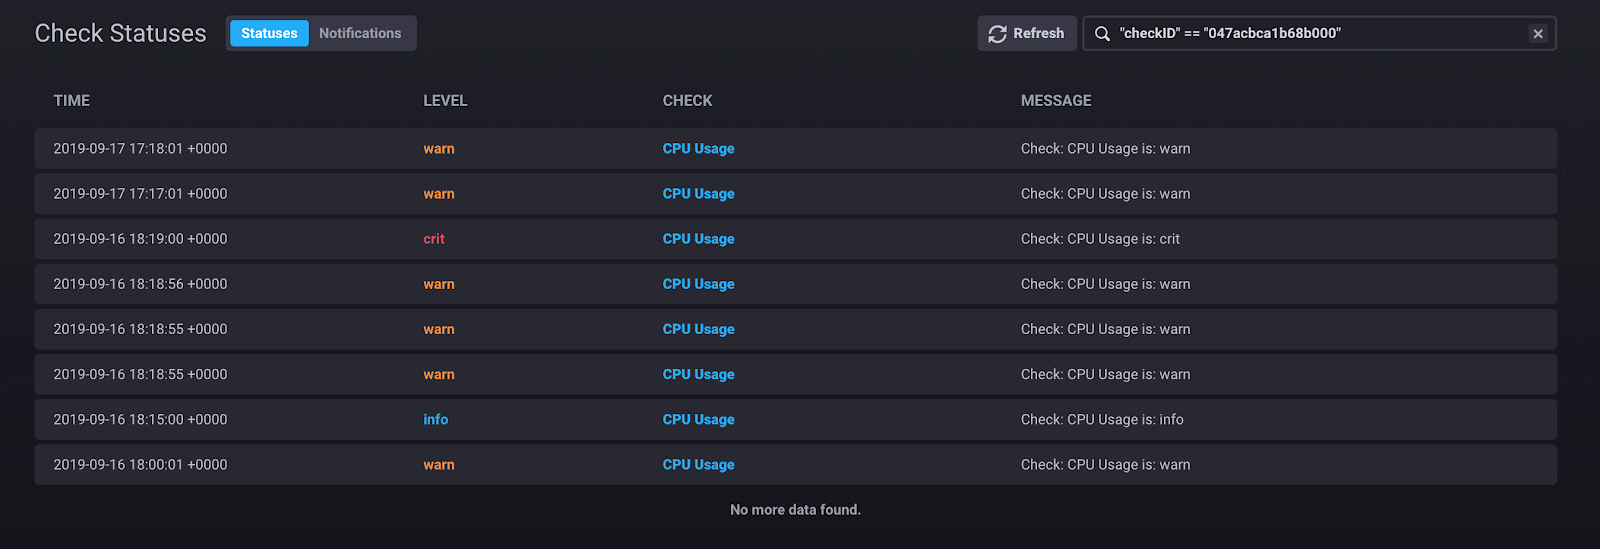
Now we know that our check is working, and we can move on to setting up notifications.
Create notifications
From the same Monitoring & Alerting tab, you’ll see two more columns for Notification Endpoints & Notification Rules.
Notification endpoints
If you’re using the free tier of Cloud 2.0, then Slack is the only Notification Endpoint available right now. That’s alright because Slack is super easy to set up. Make sure you have Slack incoming webhooks enabled. All we have to do is provide our Slack webhook URL and name the endpoint.
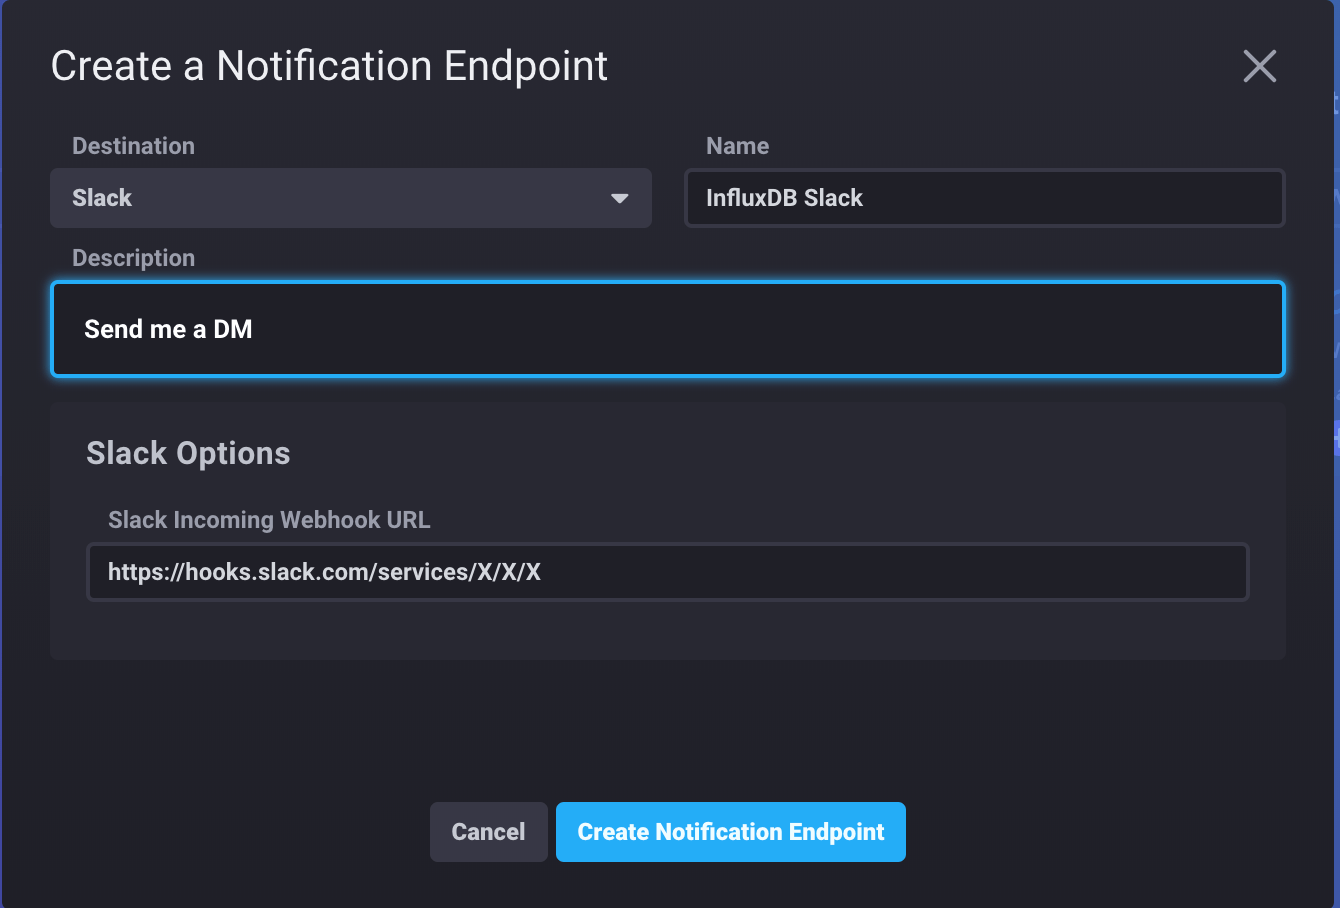
Notification rules
We’ve done most of the work. Let’s get a notification already! There’s just one last step: creating the notification rule. This step highlights the difference between checks and notifications.
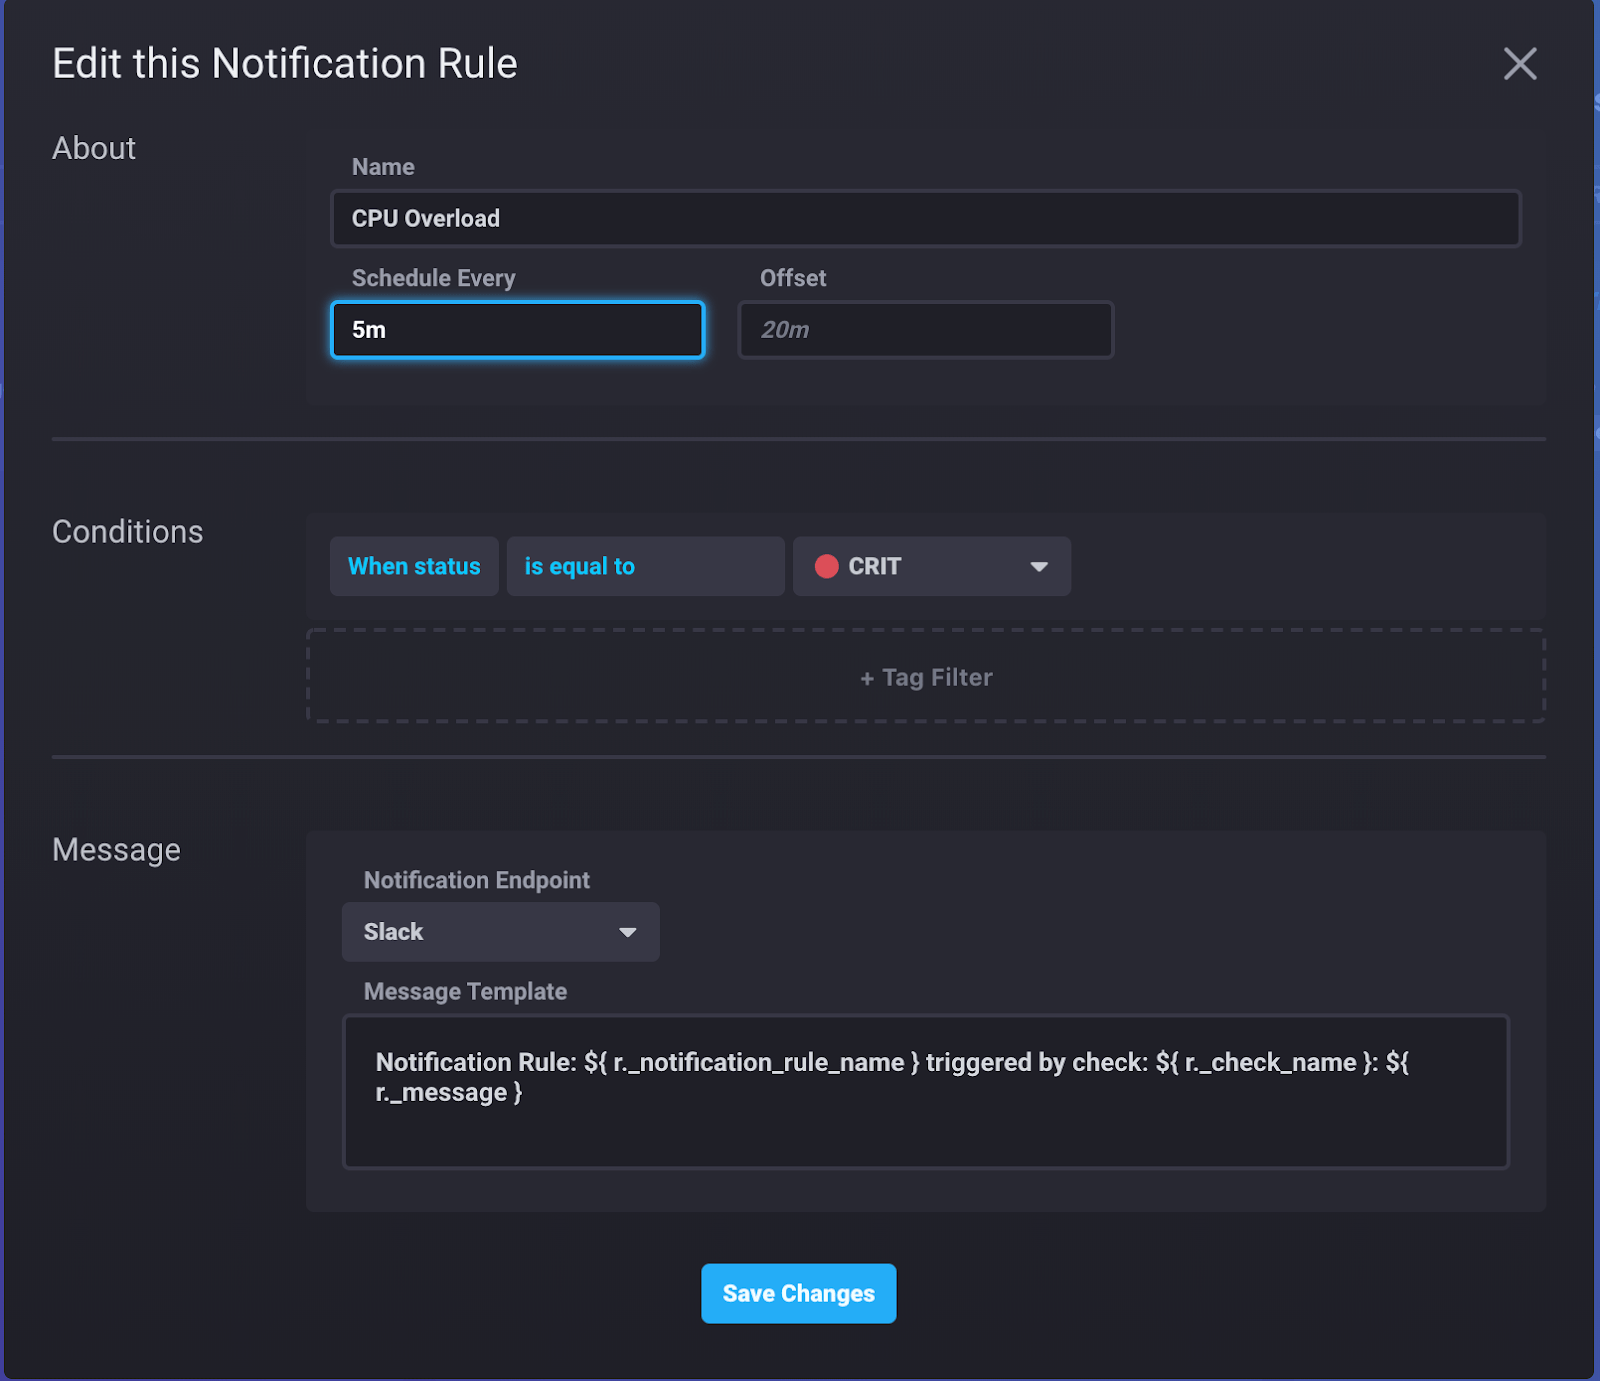
We could be running checks every 15 seconds in our system, but that doesn’t mean we necessarily want a notification. In the Notification Rule, we can determine the interval at which the notification rule should evaluate whether to actually send a notification. In the example above, my notification rule runs every 5 min and only sends me a Slack message if the status is CRIT. The rest of the data from the check is available to me in the history (and the _monitoring database), but I only want to be notified when I’m out of donuts or my CPU usage is so high that my server is about to crash.
The message template works exactly the same as the status message template in our check. We can interpolate here so that we can provide as much data as possible.

Summary
We did it! Beginning to end, it only took me a few minutes to get a Slack notification about my perilous CPU usage. Set up your own alerts using InfluxDB Cloud 2.0 and tell us what you think!
