Product Update: Monitor Your InfluxDB Cloud Dedicated Cluster
By
Scott Anderson /
Product
Jun 24, 2024
Navigate to:
InfluxDB Cloud Dedicated provides fully-managed InfluxDB v3 clusters that power enterprise-grade workloads on a scalable infrastructure dedicated to your workload and your workload alone. As a fully-managed service, InfluxData takes the infrastructure hassle off your plate by monitoring and scaling your cluster when necessary.
Until recently, cluster health-related metrics were only available to internal InfluxData support staff. To provide you access to those same metrics, InfluxDB Cloud Dedicated now gives you access to an operational dashboard that visualizes data related to the performance and health of your dedicated cluster.
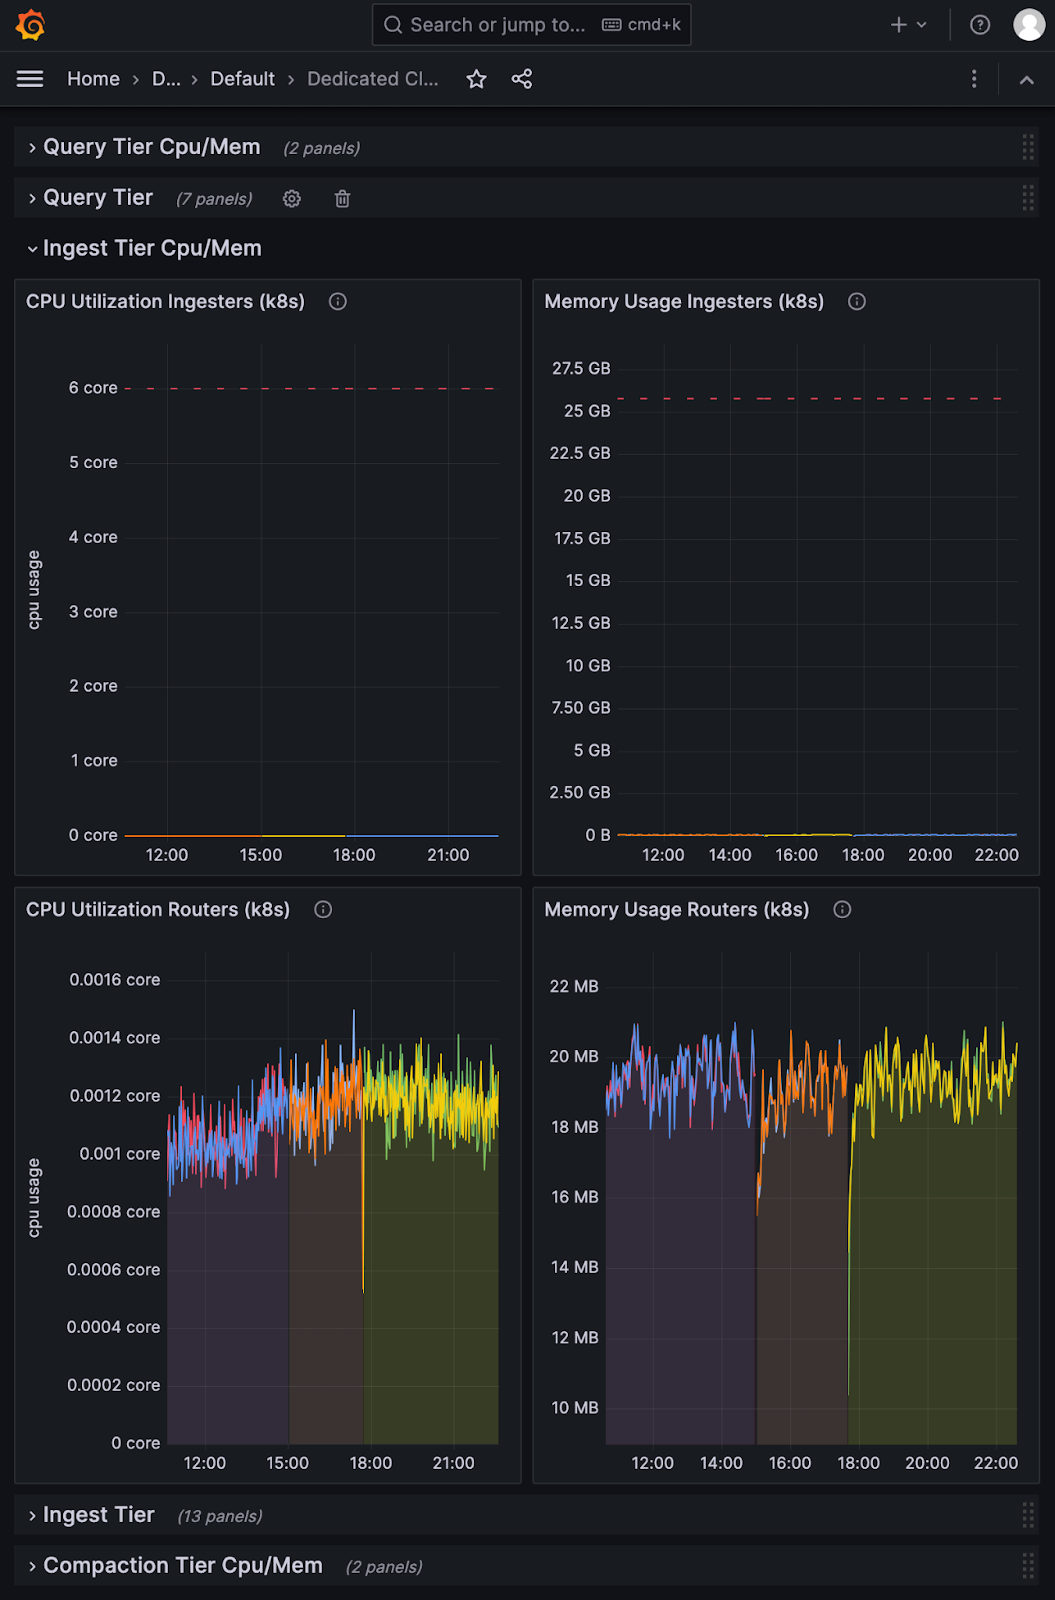
What’s in the operational dashboard?
The operational dashboard displays the same cluster health-related metrics that InfluxData support staff use to make adjustments to your cluster. As a user, this information can help you identify unintended workload changes, potential bottlenecks, optimization opportunities, and provide insight into how each component in your cluster is performing.
For information about the specific metrics available in the dashboard, see the documentation.
View your operational dashboard
The dashboard used to monitor your InfluxDB Cloud Dedicated cluster is a Grafana dashboard managed by InfluxData. By default, the operational dashboard is not enabled for all clusters. To view your cluster’s operational dashboard:
- Contact InfluxData support to enable the operational dashboard on your dedicated cluster.
- Copy your InfluxDB Cloud Dedicated cluster URL, paste it into a browser, and add /observability as the URL path. For example: https://cluster-id.a.influxdata.com/observability
- Use the credentials provided by InfluxData support to log into the Grafana dashboard.
Once logged in, you can view the operational dashboard specific to your InfluxDB Cloud Dedicated cluster.
Request access to your InfluxDB Cloud Dedicated operational dashboard
The InfluxDB Cloud Dedicated operational dashboard and the metrics displayed are subject to change. If there is information that you feel would benefit your ability to monitor your dedicated cluster, let us know.
