Getting Started with Sending StatsD Metrics to Telegraf & InfluxDB
By
Steven Soroka
updated December 14, 2025
Use Cases
Product
Developer
Getting Started
Navigate to:
Why StatsD?
There are many good reasons to use StatsD, and many good blogs about why it's great. StatsD is simple, has a tiny footprint, and has a fantastic ecosystem of client libraries. It can't crash your application and has become the standard for large-scale metric collection.How it works
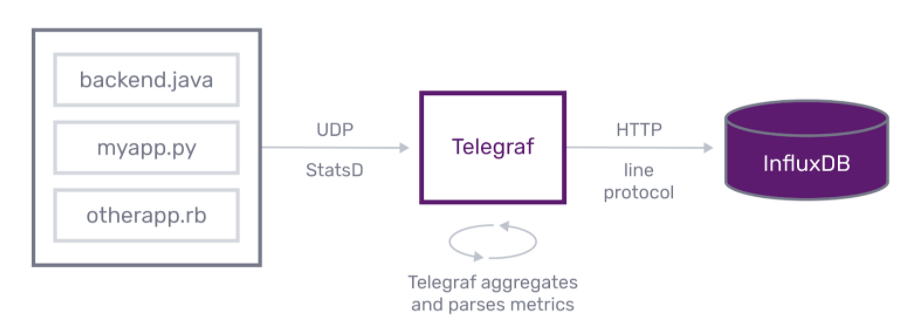
Telegraf is an agent written in Go and accepts StatsD protocol metrics over UDP, then periodically forwards the metrics to InfluxDB. StatsD metrics can be sent from applications using any of the many available client libraries. Here is a standard setup for collecting StatsD metrics:
Why UDP?
UDP is often called the “fire and forget” protocol. UDP is a connectionless protocol that does not wait for a response. UDP packets are sent without waiting for a response, aren’t slowed down by network latency, and aren’t affected by network blips that would drop connections. This means UDP is lossy, but that’s typically okay for metric data.
Setup
First, you need to have Telegraf installed. Next, you will need to setup Telegraf with the statsd plugin. The --sample-config option tells Telegraf to output a config file. --input-filter and --output-filter tell Telegraf which plugins (StatsD) and outputs (InfluxDB) to configure. (Note you should use influxdb_v2 for InfluxDB 2.0 cloud or OSS beta, and influxdb for a local InfluxDB pre 2.0):
$ telegraf --sample-config --input-filter statsd --output-filter influxdb_v2 > telegraf.conf
$ telegraf --config telegraf.conf
The config file (telegraf.conf) will assume that your InfluxDB instance is running on localhost, and will need to be edited if that’s not the case. There are also many configuration options for the StatsD server, but I won’t go into all of them in this guide, see the documentation for more details.
Sending StatsD metrics
By default, Telegraf will begin listening on port 8125 for UDP packets. StatsD metrics can be sent to it using echo and netcat:
$ echo "mycounter:10|c" | nc -C -w 1 -u localhost 8125
Or using your favorite client library.
Influx StatsD
Since InfluxDB supports tags, our StatsD implementation does too! Adding tags to a StatsD metric is similar to how they appear in line-protocol.
This means that you can tag your StatsD metrics like below. This particular metric increments theuser_login counter by 1, with tags for the service and region we are using.
user.logins,service=payroll,region=us-west:1|c
That’s it! Simply add a comma-separated list of tags in key=value format.
For those of you using a StatsD client, this extra bit can be added to the bucket. I’ll use the Python client as an example:
>>> import statsd
>>> c = statsd.StatsClient('localhost', 8125)
>>> c.incr('user.logins,service=payroll,region=us-west')  # Increment counter
Once flushed, the metric will be available in InfluxDB in all its tagged glory.
> SELECT * FROM statsd_user_logins
name: statsd_user_logins
------------------------
time                    host    metric_type  region   service  value
2015-10-27T03:26:40Z    tyrion  counter      us-west  payroll  1
2015-10-27T03:26:50Z    tyrion  counter      us-west  payroll  1
Metrics
Telegraf supports all of the standard StatsD metrics, which are detailed below.
Counters
logins.total:1|c
logins.total:15|c
A simple counter, the logins_total metric will be incremented by 1 and 15 in the above examples. Counters can be always-increasing, or you can opt to have them cleared with each flush using thedelete_counters config option.
Sampling
logins.total:1|c|@0.1
Tells StatsD that this counter is being sent sampled every 1/10th of the time. In this example, logins_total metric will be incremented by 10.
Gauges
current.users:105|g
Gauges are changed with each subsequent value sent. The value that makes it to InfluxDB will be the last recorded value. Gauges will remain at the same value until a new value is sent. You can opt to have them cleared with each flush using the delete_gauges config option.
Adding a sign can change the value of a gauge rather than overwriting it:
current.users:-10|g
current.users:+12|g
Timings & histograms
response.time:301|ms
response.time:301|h
Timings are meant to track how long something took. They are an invaluable tool for tracking application performance.
When Telegraf receives timing metrics, it will aggregate them and write the following statistics to InfluxDB, more details on each of these can be found in the documentation.
stat_name_lowerstat_name_upperstat_name_meanstat_name_stddevstat_name_countstat_name_percentile_90
Sampling
response.time:301|ms|@0.1
Timings, like counters, can also be sampled. This will let Telegraf know that this timing was only taken once every 10 runs.
Notes
Telegraf aggregates stats as they arrive, and limits the number of timings cached to keep its memory footprint low. By default, Telegraf will keep track of 1000 timings per-stat when calculating percentiles. This can be adjusted using the percentile_limit config option.
Sets
unique.users:100|s
Sets can be used to count unique occurrences. In the above example, the unique.users metric will be incremented by 1, then will not be incremented no matter how many times the value 100 is sent.
Templates
The plugin supports specifying templates for transforming statsd buckets into InfluxDB measurement names, tags, and fields using keywords. These can be used to specify parts of the bucket that are to be used in the measurement name. Other words in the template are used as tag names. For example, the following template:
templates = ["cpu.* measurement.field.region"]
This means for every metric starting with cpu. you intend to split the bucket name into three segments, the first belongs to the measurement name, the second to a field, and the last will be split off, and turned into a tag named “region”. If the original metric looked like this:
cpu.load.us-west:100|g
The resulting metric created in InfluxDB would look like this:
cpu,metric_type=gauge,region=us-west load=100
Where the metric name is cpu_load, and it has a tag named region with the value us-west.
This gives you detailed control over mapping StatsD bucket names to metrics and tags in influxdb.
Also, let us know what you’d like to see by opening an issue on GitHub.
Next steps
- Download Telegraf
- Start a Free trial of InfluxDB Cloud
