Getting Started with Mermaid for Diagramming and Charting
By
Community
updated October 20, 2023
Developer
Use Cases
Navigate to:
This post was written by Emma Bundi. Scroll down to read the author’s bio.

Visualizing data in an interactive way is critical for developers, project managers, and (obviously) data visualization specialists. You can create engaging charts, diagrams, and dashboards for your websites and web applications. And you can do all this easily with the diagramming and charting tool Mermaid.js.
Mermaid.js is JavaScript based. It renders Markdown-inspired text definitions in diagrams and charts. The syntax is easy to learn, making it highly adaptable for programmers and non-programmers alike.
In this article, we’ll teach you how to get started with Mermaid.js and use it to create interactive sequence diagrams, flowcharts, Gantt charts, pie charts, and more so you can visualize your data. We’ll also show you options for styling and theme configurations.
Why you should use Mermaid
Organizational progress requires well-explained charts and diagrams that don’t take a ton of time to implement or modify. Mermaid.js is built for simplicity and high-performance results. With Mermaid.js, creating diagrams, charts, or even documentation is achieved seamlessly, thus saving time while rendering interactive and impressive graphs.
Setting up Mermaid
To get started with Mermaid.js in your IDE, begin by installing the Mermaid.js package manager by running the following in the command line interface:
npm install -g @mermaid-js/mermaid-cliYou can subsequently initialize your HTML and script tag with an absolute tag by adding mermaid.initialize to the HTML file as shown below:
The code above allows you to define a class in HTML that renders it as Mermaid.js syntax. Alternatively, you can install the Markdown Preview Mermaid Support on Visual Studio Code, which is a plugin to showcase your diagrams and charts. There are further installation alternatives on Mermaid’s GitHub page. Depending on your end goal, you can also use the Mermaid.js live editor, which is also quite friendly to programmers and non-programmers who need to quickly render diagrams and charts.
How to create diagrams and charts with Mermaid
Visualizing a messaging interaction sequence diagram
A sequence diagram focuses on how objects interact with one another. Complex object interactions thus become easier to explain and understand with engaging sequence diagrams.
Mermaid.js makes the process of creating interaction diagrams easier by utilizing diagrams as code using Markdown. Participants or actors in a sequence diagram are rendered in order of appearance in the diagram source text. Additionally, actors can be grouped in vertical boxes, where you can choose to define their color.
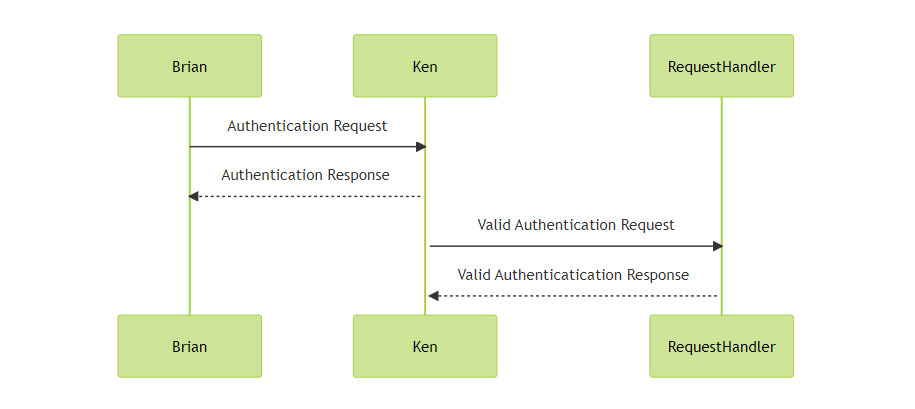
Authentication requests and responses are regular interactions in messaging applications. As shown below, you can easily showcase a sequence diagram between two participants, Brian and Ken.
sequenceDiagram
Brian->>+Ken: Authentication Request
Ken-->>+Brian: Authentication Response
Ken->>+RequestHandler: Valid Authentication Request
RequestHandler-->>+Ken: Valid Authenticatication Response
The above Markdown syntax shows validated message interaction between Brian and Ken. Here is the immediate markup output of the sequence diagram of the verified messages.
Syntax flow for flowcharts
Mermaid.js allows you to create different types of diagrams, which means your Markdown syntax has to begin by defining the title and the diagram in question followed by your preferred data specifications.
Declaring the title is always preceded by predefining the title string like this: title: A Data Structure Flowchart
Follow that up by declaring that you’re building a flowchart, such as flowchart.
Flowcharts are composed of nodes that come with direction orientation as well. You can choose the direction specification of your flowchart with TD for top-down or LR for left-right. Other directions include TB for top-bottom, BT for bottom-top, and RL for right-left.
Node shapes are defined by the type of brackets that wrap your node text. Square brackets form a rectangle, while double parentheses form a circular node. Subsequently, a node with round edges will be defined by single parentheses.
Different nodes are also linked together by arrows.

Visualizing the code development process with a flowchart
Mermaid.js flowcharts are composed of nodes that outline the interaction by linking them with different arrow types and multidimensional arrows.
For proper and appealing visualization purposes, a flowchart can easily showcase a company’s code development process by writing the Markdown code using Mermaid.js. Flowcharts are important when showcasing the code flow in a given architecture or explaining how to navigate a website, among other use cases. For example, as a programmer, you may want to visualize the development process taken by an organization from planning to deploying and monitoring code. This code will be shown as follows:
flowchart TD
A([Planning]) -->B{Analysis}
B-->C(Design)
C -->D[Development]
D-->E{Testing}
E-->F[Implementation]
F -->G{Maintenance}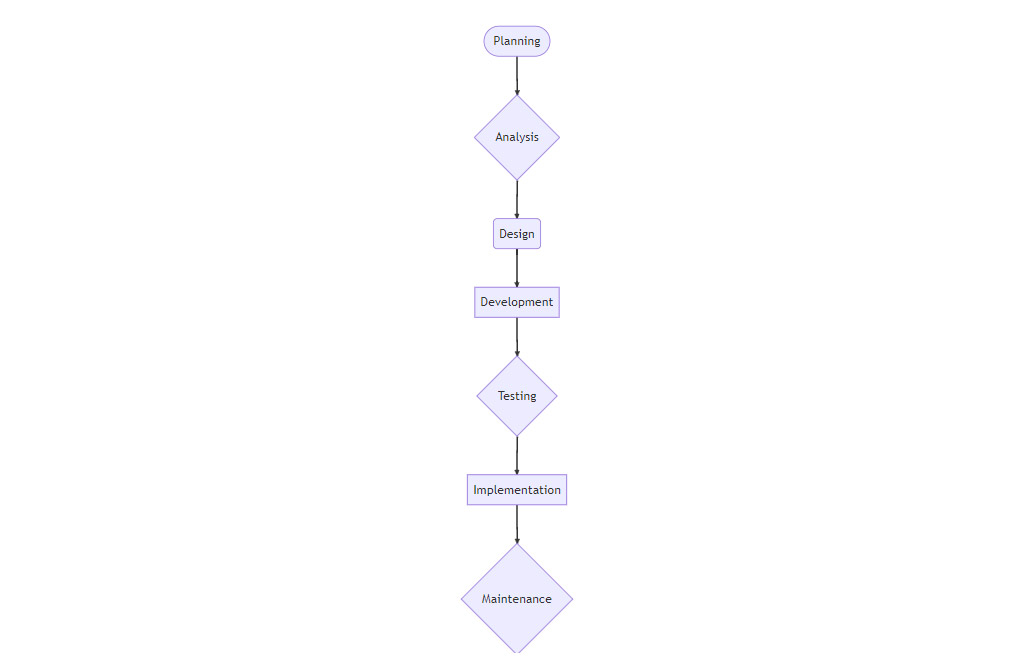
Visualizing a survey process with a Gantt chart
Gantt charts make project management and visualization easier by indicating who does what and their activity status. You can also use them to outline the timelines of different data collection processes. However, making and modifying a Gantt chart needs to be simplified in such a way that editing the information isn’t a headache. Project parts in a Gantt chart can be divided by the use of the section keyword.
Here’s a Gantt chart with code as a chart showing the survey data collection process by a firm:
gantt
    title A Survey Process Gantt Chart
    dateFormat  YYYY-MM-DD
    section Sect1
    Short Survey           :a1, 2023-01-01, 20d
    Data Processing     :after a1  , 20d
    section Sect2
    Periodical Feedback Report      :2023-01-12  , 12d
    User Testing and Data Exploration      : 20d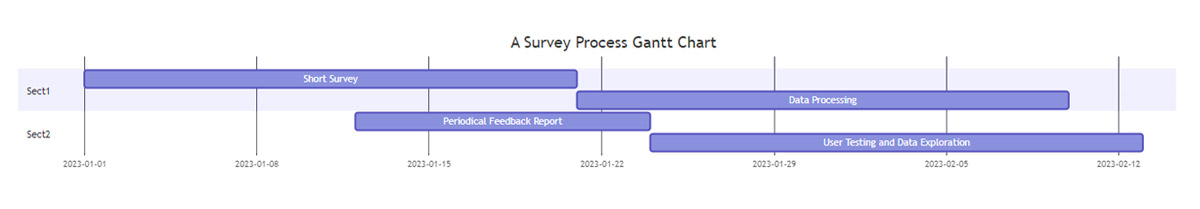
Visualizing drug abuse prevalence with a pie chart
A pie chart is a type of graph that uses a circular representation divided into sectors to illustrate the information. Let’s say you’re a data visualization specialist who wants to visualize the number of recorded drug abuse cases according to age brackets. You can do this using a pie chart.
Below is the Markdown syntax for creating the pie chart with Mermaid.js:
pie title Recorded Cases of Drug Abuse in St.Peter's Ward
    "18-25" : 1000
    "26-35" : 850
    "36-42" : 450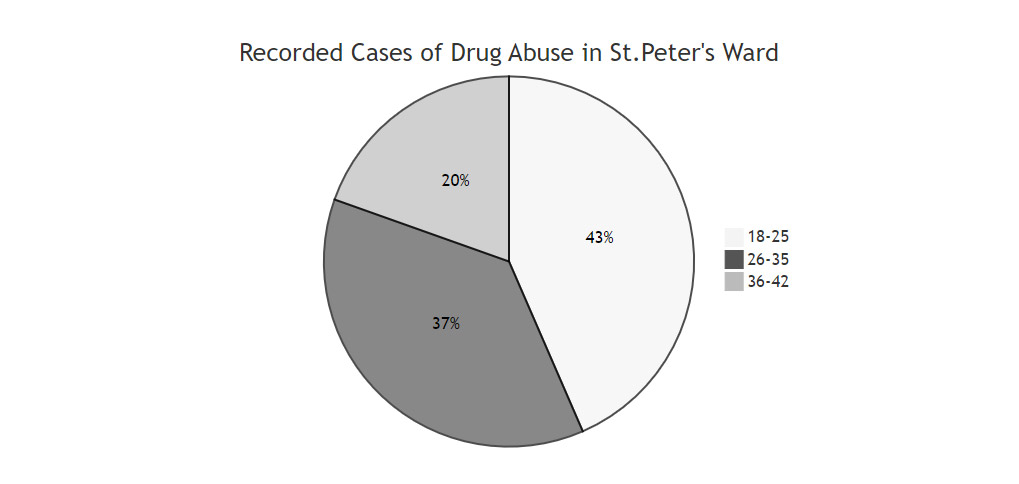
Styling Mermaid visualizations
There are different ways to style visualizations with Mermaid.js, depending on the development choice and case. These can be informed by the type of diagrams and charts in question, the font and color branding of the organization, or the preferred themes for your work. Additionally, the styling options range from changing the border widths and color themes to adding icons.
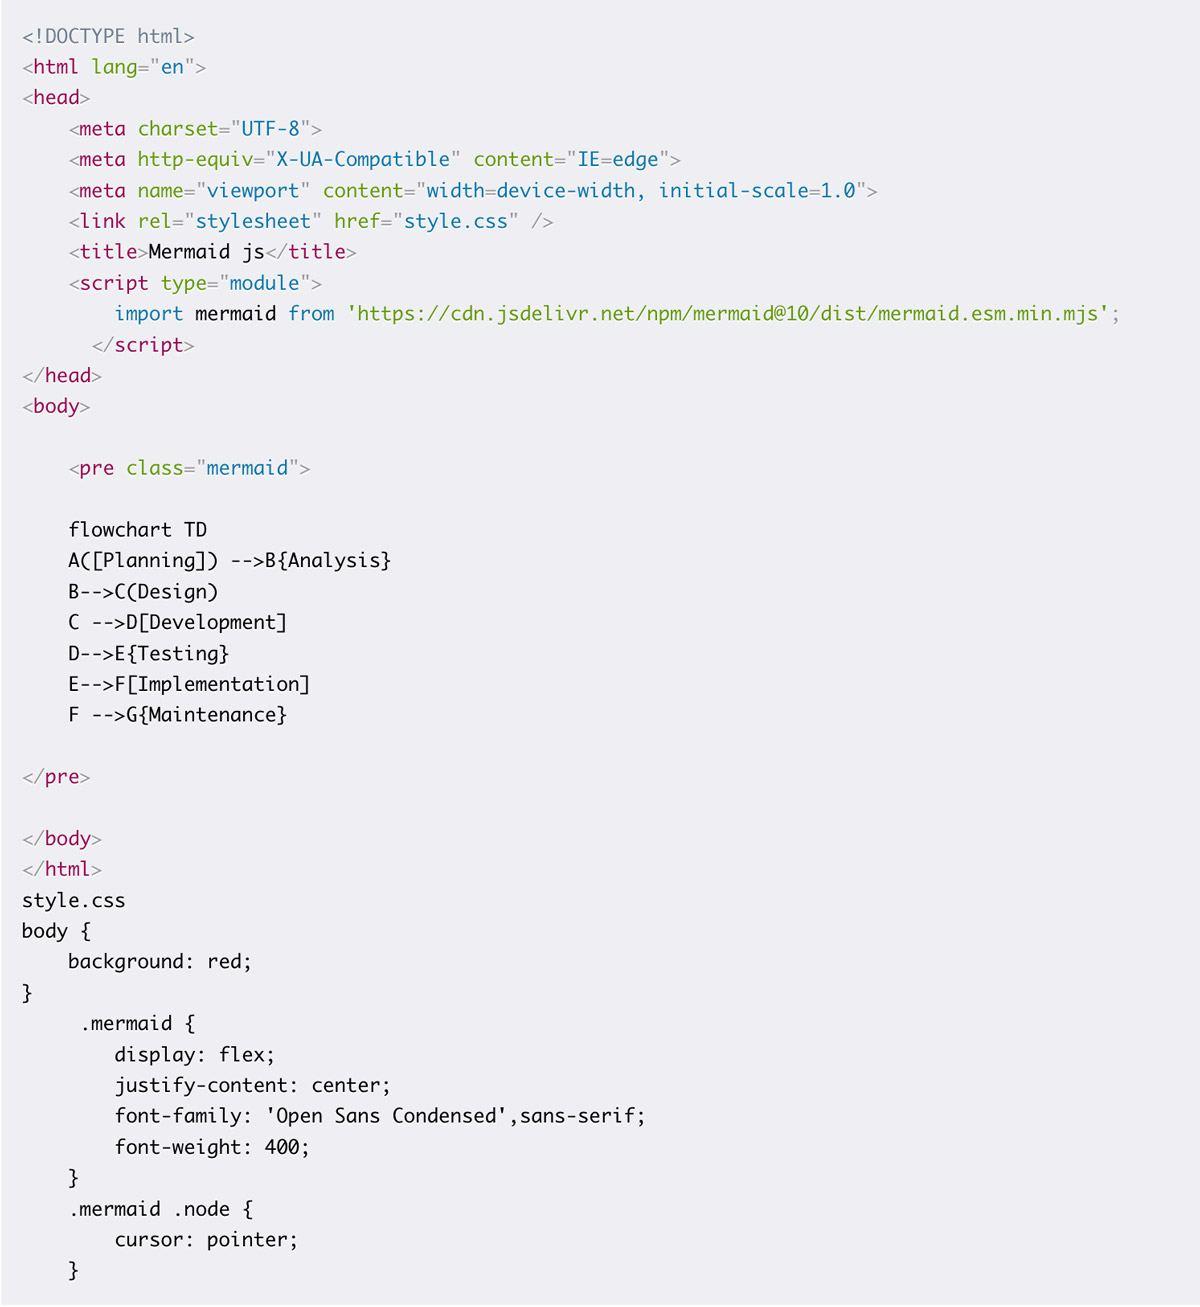
With Mermaid.js, you can use custom CSS to style your graphs. To style your Mermaid.js HTML class, you need to predefine the classes in CSS that you initialized in your graph definition. However, note that it’s not currently possible to define CSS classes within the diagram itself.
Here is how you predefine your HTML classes and style with custom CSS in a flow chart: index.html
Mermaid.js allows for further specifications for your Markdown syntax and styling. In a sequence diagram, you can style a solid message line by using the messsageLine0 class or the actor box at the top of the diagram by using the actor class. These classes and default styles differ depending on the diagram or chart in question. You can explore the documentation to learn more.
Theme configuration
Mermaid also allows you to configure your preferred theme by using the init directive. Below are the available themes:
-
default, the default theme for all diagrams
-
dark, for dark-colored elements or dark mode
-
neutral, for elements to be printed
-
forest, to bring in a shade of green
-
base, the only modifiable theme with Mermaid.js
The themeVariables via init allows for modification of your base theme. You can subsequently add your config syntax on the config tab in your live editor or define the syntax before your Markdown diagram in your IDE as shown below.
%%{init: { "theme": "forest" } }%%
flowchart TD
A([Planning]) -->B{Analysis}
B-->C(Design)
C -->D[Development]
D-->E{Testing}
E-->F[Implementation]
F -->G{Maintenance}
Conclusion
Mermaid.js is revolutionary in the way it allows data specialists, project managers, and front-end programmers to create visually appealing diagrams and charts. Modifying this data is less time- consuming than ever because you can easily change the syntax to accommodate new plans and data in an instant. While you’re at it, you can break down the tedious work of coming up with diagrams and charts.
About the author
This post was written by Emma Bundi. Emma is a web developer and technical writer. She is enthusiastic about FOSS and its tremendous impact to programming. She is also keen on teaching other developers what she has learnt through technical writing. Mwendwa is that book nerd, almost always reading.
