Using InfluxDB and NODE-RED to Bring Your Data to Life
By
David G. Simmons
updated December 14, 2025
Product
Use Cases
Developer
Navigate to:
Putting your IoT data into a backend system is great. Being able to query and visualize your IoT data is even better. Making your IoT data actionable is, really, what should be the ultimate goal of an IoT data system. As we’ve seen in previous posts, the first few things are relatively straight forward and easy to do. As we’ll see next, making actionable data is likewise straightforward and relatively easy.
Visualizing your data allows you, in real time, to see your data and gain insights you might otherwise not have. It’s an extremely useful tool in the IoT Data toolkit, but it’s not enough to see your data while analyzing it. IoT data, in order to be useful, must be actionable. The example I’m about to give is a simplistic one, but it is easily extensible to other use cases. I’ll use my sensor data to create alerts and then use those alerts to create a visual alert using a GlowOrb.
Since I’m already collecting sensor data from a number of sensors (see my previous post on the subject) I won’t go over that again, but feel free to refresh your memory on that previous post.
I’m also going to use NODE-RED for this example, so you should have NODE-RED installed and running already, along with your InfluxData TICK Stack installation. That covers the prerequisites, so let’s dive in.
Configuring NODE-RED
Node red is fairly simple to set up and get running. Using the GlowOrb is even easier. Once I’ve connected my GlowOrb to my WiFi, I simply visit http://mqtt.org/GO/XXXX-YYYY/ (the serial number of my GlowOrb) and I’m given a complete NODE-RED setup JSON:
[
	{
		"id": "6f3203ca.13859c",
		"type": "inject",
		"z": "58595b89.4b164c",
		"name": "red",
		"topic": "",
		"payload": "#ff0000",
		"payloadType": "str",
		"repeat": "",
		"crontab": "",
		"once": false,
		"x": 170,
		"y": 300,
		"wires": [
			[
				"e3af354.bd4ccc8"
			]
		]
	},
	{
		"id": "3d87bb90.0141bc",
		"type": "inject",
		"z": "58595b89.4b164c",
		"name": "green",
		"topic": "",
		"payload": "#00ff00",
		"payloadType": "str",
		"repeat": "",
		"crontab": "",
		"once": false,
		"x": 170,
		"y": 340,
		"wires": [
			[
				"e3af354.bd4ccc8"
			]
		]
	},
	{
		"id": "b446c882.3503c8",
		"type": "inject",
		"z": "58595b89.4b164c",
		"name": "blue",
		"topic": "",
		"payload": "#0000ff",
		"payloadType": "str",
		"repeat": "",
		"crontab": "",
		"once": false,
		"x": 170,
		"y": 380,
		"wires": [
			[
				"e3af354.bd4ccc8"
			]
		]
	},
	{
		"id": "e3af354.bd4ccc8",
		"type": "mqtt out",
		"z": "58595b89.4b164c",
		"name": "GlowOrb XXXX-YYYY",
		"topic": "iot-2/evt/command/fmt/text",
		"qos": "",
		"retain": "",
		"broker": "3ecd43e1.c325e4",
		"x": 410,
		"y": 340,
		"wires": [

		]
	},
	{
		"id": "ee113762.3d4e5",
		"type": "mqtt in",
		"z": "58595b89.4b164c",
		"name": "cheerlights",
		"topic": "cheerlightsRGB",
		"qos": "2",
		"broker": "3c0e7ff3.d2e5b8",
		"x": 160,
		"y": 440,
		"wires": [
			[

			]
		]
	},
	{
		"id": "3ecd43e1.c325e4",
		"type": "mqtt-broker",
		"z": "",
		"broker": "jit4q3.messaging.internetofthings.ibmcloud.com",
		"port": "1883",
		"clientid": "d:jit4q3:GlowOrbControl:XXXX-YYYY",
		"usetls": false,
		"compatmode": false,
		"keepalive": "60",
		"cleansession": true,
		"willTopic": "",
		"willQos": "0",
		"willRetain": "false",
		"willPayload": "",
		"birthTopic": "",
		"birthQos": "0",
		"birthRetain": "false",
		"birthPayload": "",
		"credentials": {
			"user": "use-token-auth",
			"password": "cMlWUog8wY+Qp1LIyw"
		}
	},
	{
		"id": "3c0e7ff3.d2e5b8",
		"type": "mqtt-broker",
		"z": "",
		"broker": "iot.eclipse.org",
		"port": "1883",
		"clientid": "",
		"usetls": false,
		"compatmode": true,
		"keepalive": "60",
		"cleansession": true,
		"willTopic": "",
		"willQos": "0",
		"willPayload": "",
		"birthTopic": "",
		"birthQos": "0",
		"birthPayload": ""
	}
]
It’s a large wad of JSON, but if you copy and paste it into a NODE-RED Flow, you get the following:
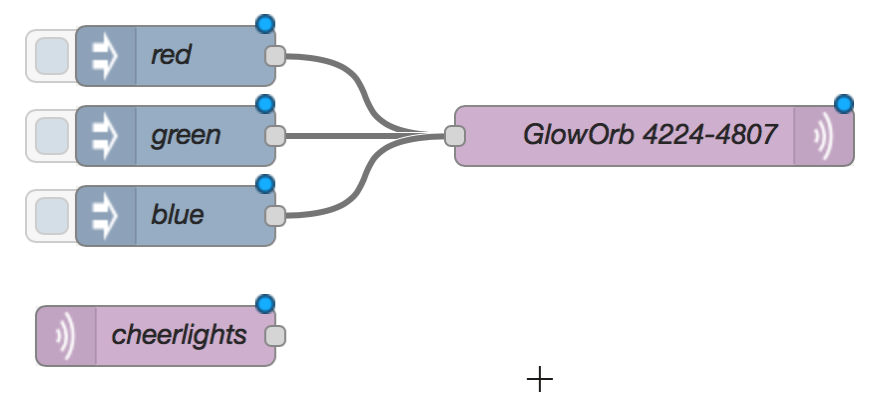
Clicking on any of those blue boxes will change the color of your GlowOrb to the corresponding color. But that’s not what we want, so we’ll add a couple of http end-point nodes to change the color based on an http notification.
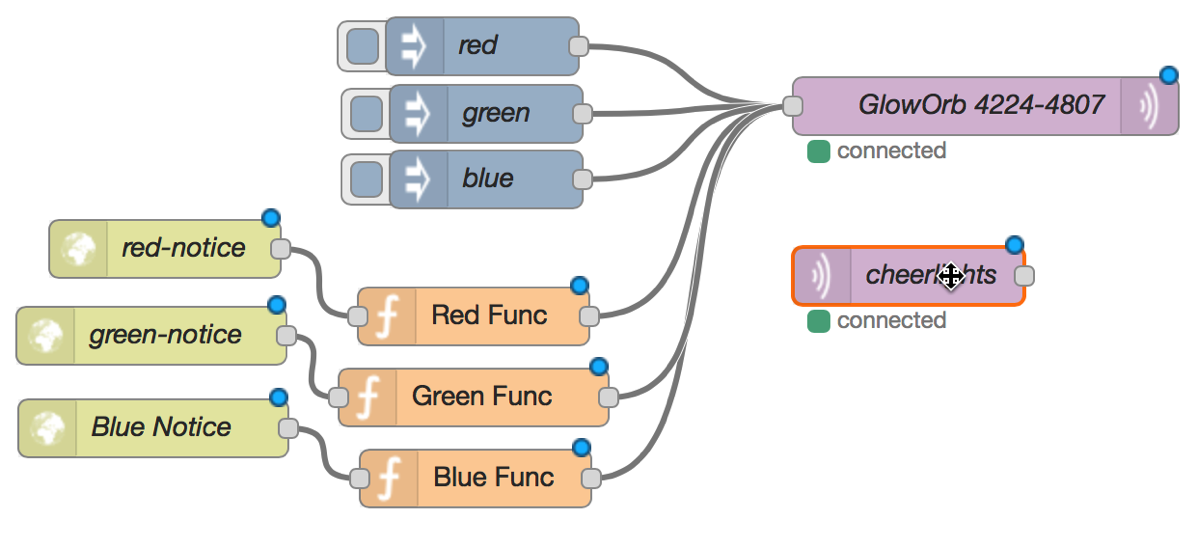
I define those “-notice” nodes as follows:
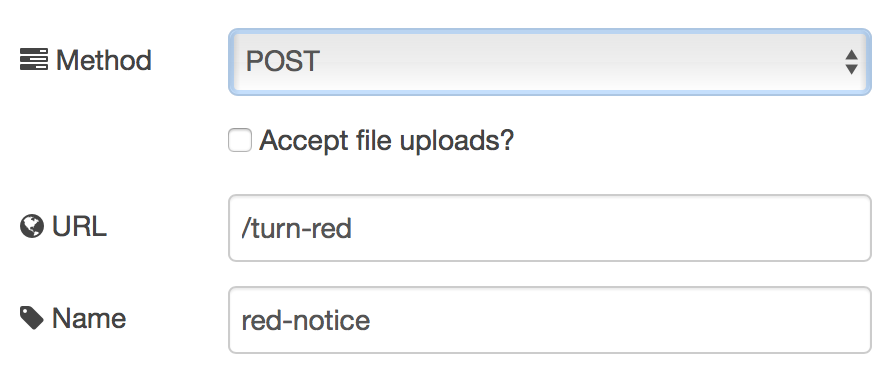
And now I’ve got http end-points for my Kapacitor alerts!
Setting up the Kapacitor Alerts
Now that I have the GlowOrb set up, and the proper end-points for http notifications, all I have to do is set up the Kapacitor alerts! In Chronograf, I navigate to the ‘Alerts’ tab, and then the ‘Alert Rules’ tab, and define a new alert rule, then create a query:
![]()
And then define when the alert is to happen (the trigger)

and what is supposed to happen:
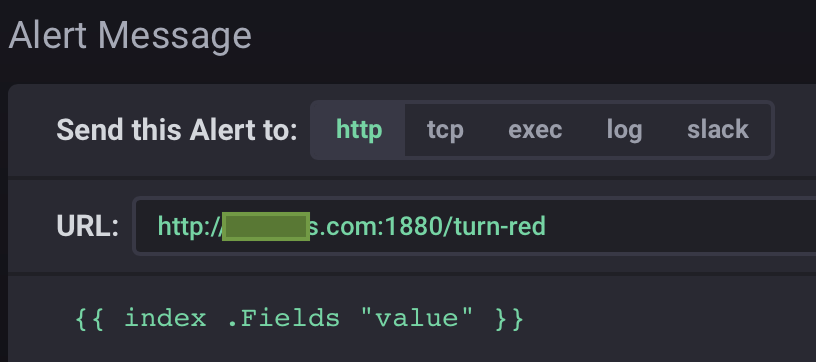
So now my alert will go to my NODE-RED end-point that I defined earlier whenever the temperature reading passes 85.1º F. And indeed if I look in the debug console of my NODE-RED server, I see:
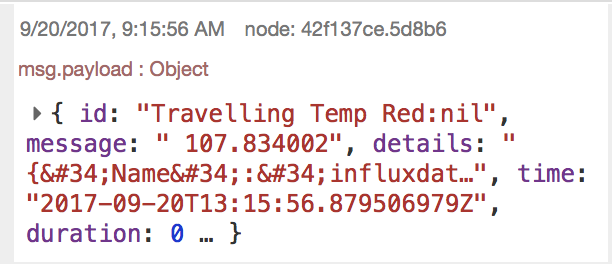
This shows that it’s really hot! I should do something about that. In addition, my GlowOrb has turned Red! Success!
Refining the Alerts
What I really want is to be able to show a bit more precision in my colors, based on the temperature. For that, I had to write a custom TICK script as follows:
var db = 'iotdata'
  var rp = 'autogen'
  var measurement = 'influxdata_sensors'
  var groupBy = [*]
  var whereFilter = lambda: ("location" == 'TravelingWilbury')
  var name = 'relative-temp'
  var idVar = name + ':{{.Group}}'
  var message = ' {{ index .Fields "value" }}'
  var idTag = 'alertID'
  var levelTag = 'level'
  var messageField = 'message'
  var durationField = 'duration'
  var outputDB = 'chronograf'
  var outputRP = 'autogen'
  var outputMeasurement = 'alerts'
  var triggerType = 'relative'
  var shift = 5s
  0s
  var crit = 0.5
  var data = stream
   |from()
     .database(db)
     .retentionPolicy(rp)
     .measurement(measurement)
     .groupBy(groupBy)
     .where(whereFilter)
   |eval(lambda: "temp_f")
     .as('value')
   |window()
     .period(3s)
     .every(1s)
     .align()
  var max = data
   |max('value')
     .as('value')
  var min = data
   |min('value')
     .as('value')
  var trigger = max
   |join(min)
     .as('max', 'min')
     .tolerance(100ms)
   |eval(lambda: float("max.value" - "min.value"))
     .keep()
     .as('chng')
   |log()
     .level('ERROR')
  trigger
   |influxDBOut()
     .create()
     .database('derived_iotdata')
     .measurement('influxdata_sensors')
  trigger
   |alert()
     .crit(lambda: abs("chng") > crit)
     .stateChangesOnly()
     .message(message)
     .id(idVar)
     .idTag(idTag)
     .levelTag(levelTag)
     .messageField(messageField)
     .durationField(durationField)
     .post('http://XXXX.com:1880/sensor-reading')
  trigger
   |influxDBOut()
     .create()
     .database(outputDB)
     .retentionPolicy(outputRP)
     .measurement(outputMeasurement)
     .tag('alertName', name)
     .tag('triggerType', triggerType)
  trigger |httpOut('output')
That looks like a lot, but for the most part I let Chronograf build the script for a ‘relative’ alert and then made a few changes. The changes I made were to add:
|window()
        .period(3s)
        .every(1s)
        .align()
and
trigger
    |influxDBOut()
        .create()
        .database(outputDB)
        .retentionPolicy(outputRP)
        .measurement(outputMeasurement)
        .tag('alertName', name)
        .tag('triggerType', triggerType)
so that the data would align properly when making the comparison and then I added another trigger that writes the previous temperature, the current temperature, and the change value back to a different database so I could then monitor my monitoring of the temperature. How meta!
Finally, I had to make a few changes to my NODE-RED script as follows:
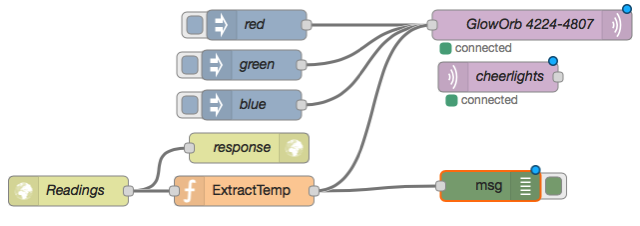
I created an end-point for the alert called ‘readings’ (and deleted the others), and then an http response for the endpoint (so that the connection would close properly). The response node just returns the HTTP code 204. As for the ‘ExtractTemp’ node, I had to write a small bit of JavaScript for that:
var myMsg = {};
var val =  myData.data.series[0].values[0][2];
node.log(val);
if(val > 90){
    myMsg.payload = "#ff0000";
    return myMsg;
} else if (val > 88){
    myMsg.payload = "#ff4000";
    return myMsg;
} else if (val > 86){
    myMsg.payload = "#ff8000";
    return myMsg;
} else if (val > 84){
    myMsg.payload = "#ff8000";
    return myMsg;
} else if (val > 82){
    myMsg.payload = "#ffff00";
    return myMsg;
}else if (val > 80){
    myMsg.payload = "#bfff00";
    return myMsg;
} else if (val > 78){
    myMsg.payload = "#80ff00";
    return myMsg;
} else if (val > 76){
    myMsg.payload = "#40ff00";
    return myMsg;
}else if (val > 74){
    myMsg.payload = "#00ff00";
    return myMsg;
}else if (val > 72){
    myMsg.payload = "#00ff40";
    return myMsg;
} else if (val > 70){
    myMsg.payload = "#00ff80";
    return myMsg;
} else if (val > 68){
    myMsg.payload = "#00ffbf";
    return myMsg;
} else if (val > 66){
    myMsg.payload = "#00ffff";
    return myMsg;
} else if (val > 64){
    myMsg.payload = "#00bfff";
    return myMsg;
} else if (val > 62){
    myMsg.payload = "#0080ff";
    return myMsg;
} else if (val > 60){
    myMsg.payload = "#0040ff";
    return myMsg;
} else if (val > 58){
    myMsg.payload = "#0000ff";
    return myMsg;
} else if (val > 56){
    myMsg.payload = "#4000ff";
    return myMsg;
} else if (val > 54){
    myMsg.payload = "#8000ff";
    return myMsg;
} else {
    myMsg.payload = "#bf00ff";
}
return myMsg;
And now my GlowOrb changes color every 2-degree increment. I took the colors from the W3Schools for simplicity.
Conclusions
This was a fun project that was relatively simple to set up using NODE-RED and InfluxDB. I was able to quickly turn my sensor readings into data, and then make that data both visible in a dashboard as well as have an effect in the physical world. It’s a simplistic example, but I could have just as easily connected the output to a servo-motor controlling the air conditioning vent to moderate the temperature, etc.
The question now is: what will you control?
