Algorithmia ML Model Performance Visualization Made Easy with This InfluxDB Template
By
Anais Dotis-Georgiou
updated December 14, 2025
Product
Use Cases
Developer
Navigate to:
Measuring your machine learning model will help you understand how well your model is doing, how useful it is, and whether your model can perform better with more data. This is what Algorithmia Insights – a feature of Algorithmia Enterprise MLOps platform – does.
Algorithmia platform accelerates your time to value for ML by delivering more models quickly and securely, as it is estimated that 85% of machine learning models never make it to production.
Algorithmia MLOps platform in brief
Algorithmia platform includes capabilities for data scientists, application developers, and IT operators to deploy, manage, govern and secure machine learning and other probabilistic models in production.
The platform’s recently introduced feature, Algorithmia Insights, is a flexible integration solution for ML model performance monitoring. It provides a metrics pipeline that can be used to instrument, measure, and monitor your machine learning models.
Monitoring your MLOps pipeline helps ensure that your model training and deployment are successful. It also helps data scientists evaluate model drift and perform model maintenance as needed. Premade dashboards help cut down on setting up monitoring ML workloads so data scientists can play to their strengths and focus on the models themselves.
How to gain performance insights of your machine learning models
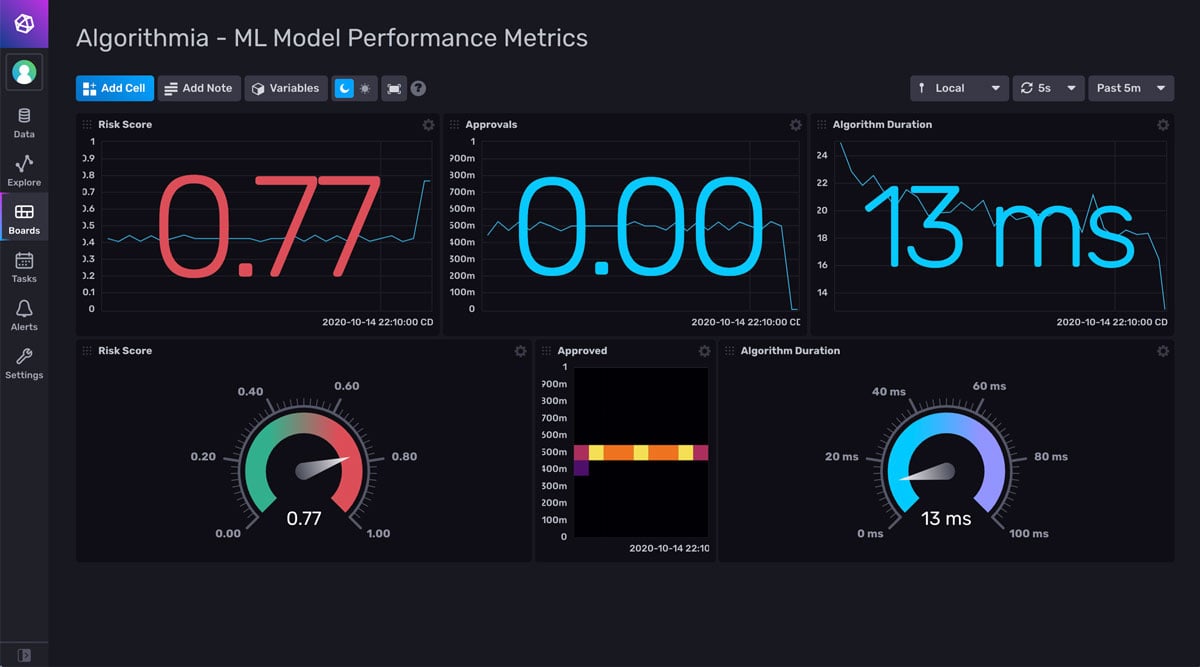
The Algorithmia ML Model Performance Metrics Template, an InfluxDB Template, allows you to stream operational metrics and user-defined, inference-related metrics from Algorithmia to InfluxDB using Telegraf and Kafka to help you gain performance insights of your models. With eight built-in time series visualization types and tons of customizations, the InfluxDB Algorithmia Template allows you to quickly derive meaningful insights about your model with just a glance at the dashboard.

InfluxDB Templates let you quickly define your entire monitoring configuration (data sources, dashboards, alerts) for any technology in one easily-shared, open-source text file that can be imported into InfluxDB with a single command.
To install this template, sign up for your free InfluxDB Cloud account.
InfluxDB for monitoring machine learning models
If you’re just starting with InfluxDB and machine learning, I recommend visiting github.com/influxdata/Notebooks for a variety of examples on time series forecasting and anomaly detection with Jupyter Notebooks.
InfluxDB is suited for machine learning given its high ingestion rate, scalability and flexible built-in retention policies. The Algorithmia ML Model Performance Metrics Template, in addition to making it easy to monitor Algorithmia ML Model performance metrics by providing the pre-made dashboard shown above, also puts InfluxDB attributes to work for your use case.
Collecting ML algorithm performance metrics in InfluxDB enables you to successfully manage your ML life cycle and governance. Storing those metrics in InfluxDB provides you with the foundation to easily create alerts on any mission critical ML workloads and receive notifications when your algorithms require maintenance.
Algorithmia ML model performance metrics
The Algorithmia ML model performance metrics that users can monitor depend on the algorithm selection and use case. However, they might include metrics like:
- Risk Score
- Approvals
- Algorithm Duration
Risk Score and Approvals are metrics specific to this Python Algorithmia example while Algorithm Duration is one of many automatically-created metrics for every algorithm execution.
Interested in submitting your own InfluxDB Template? Learn how to build one.
