Network performance monitoring
Maintain responsive and performant networks no matter how widely distributed your resources are.
Or subscribe on AWS, Azure, or Google Cloud
Why monitor network performance?
When network speed degrades or connectivity fails, the data flow sustaining applications and IT operations will struggle or halt along with the network. Networks — the lifeline of IT infrastructure — are dynamic environments. They require monitoring to deliver consistent, predictable network performance.
Networks play a fundamental role in the adoption and growth of Internet applications. Penetrating enterprises, homes, factories, and even cities, networks sustain modern society. While assuring responsive and performant networks in today’s hybrid, distributed and containerized application environments occurs behind the scenes in intangible clouds and diagrams abstractions, network glitches are more visible and unforgiving than ever.

The basics of network performance monitoring
Network availability, responsiveness, and bandwidth consumption are the three pillars that separate unmonitored from the monitored networks — and if you feed this data into a centralized time series platform you will be able to have a holistic view of your network performance monitoring.
Network availability
Network availability refers to host reachability. If the network is unavailable, there could be something related to the endpoint health or network path (such as a load balancer’s sessions limit or expired SSL) preventing traffic from reaching the host.
Network responsiveness
Network responsiveness is the combination of latency and packet loss. Latency refers to the time it takes for traffic to cross the network to a target, and packet loss determines the error rate experienced. Latency and packet loss render the network suitable for all or some more sensitive applications. For instance, high latency will completely undermine unified communications (voice & video) services.
Network bandwidth consumption
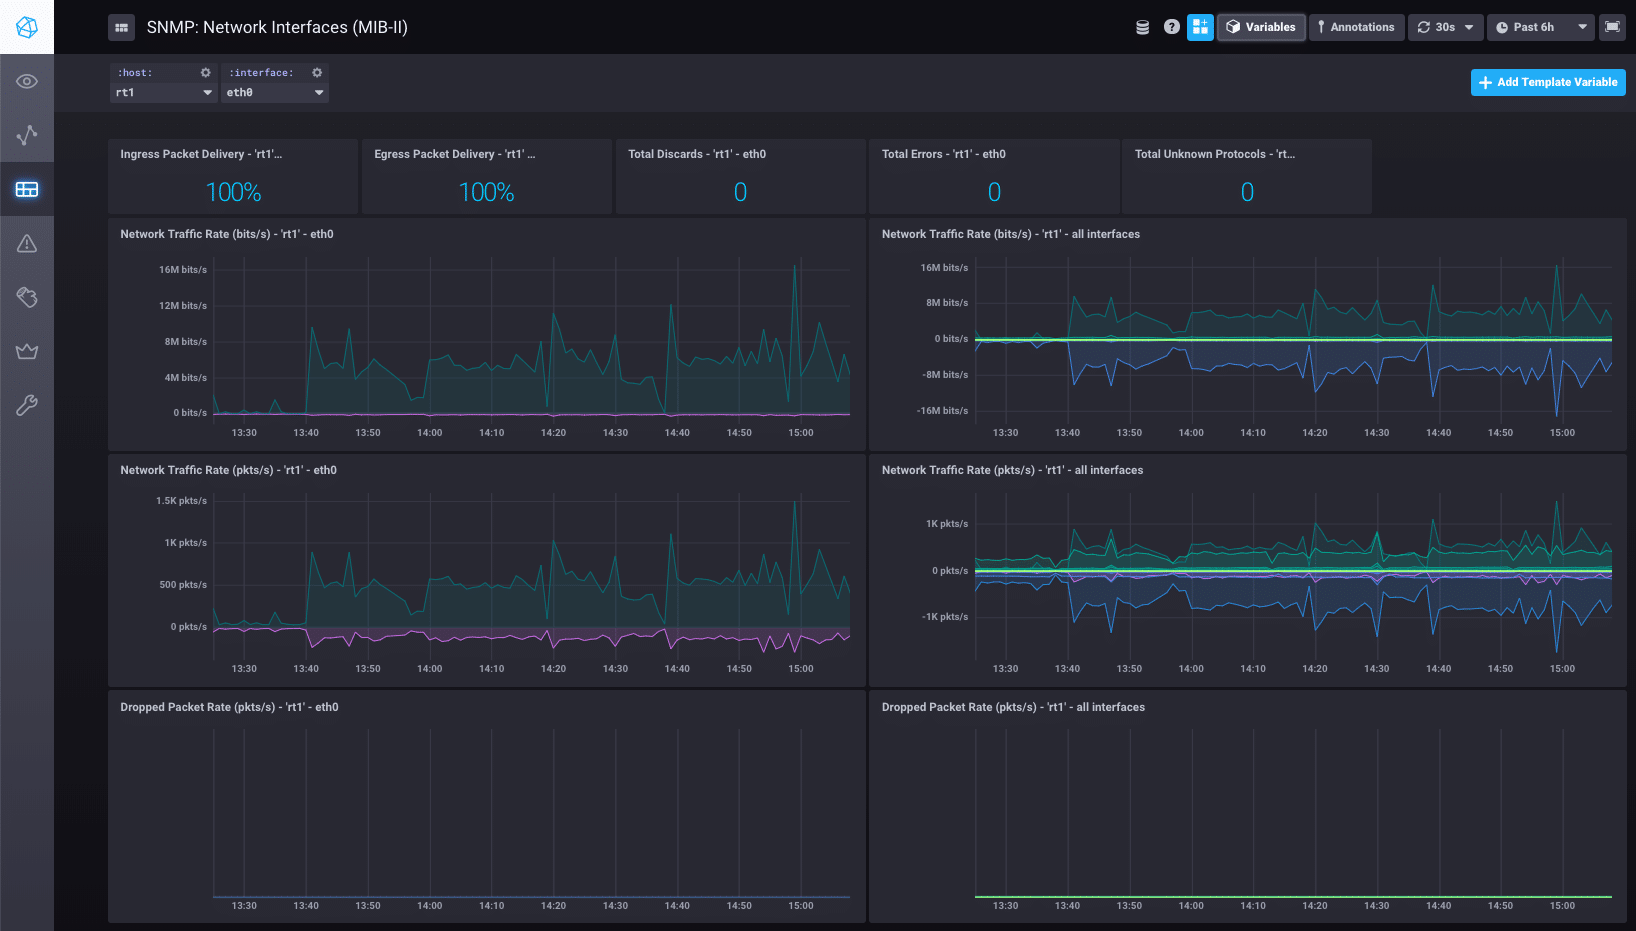
Network bandwidth consumption tracks metrics from the network interface providing important information about bandwidth load at the interface, which can be used to set up alerts before the interface is completely saturated. Adding to the network interface metrics data from network traffic analysis appliances allows for identification of bandwidth consumption struggles, providing precious insights about sessions and IPs/protocol/port troublemakers that are causing saturation, as well as identifying resource misuse and potential Denial of Service (DoS) attacks.
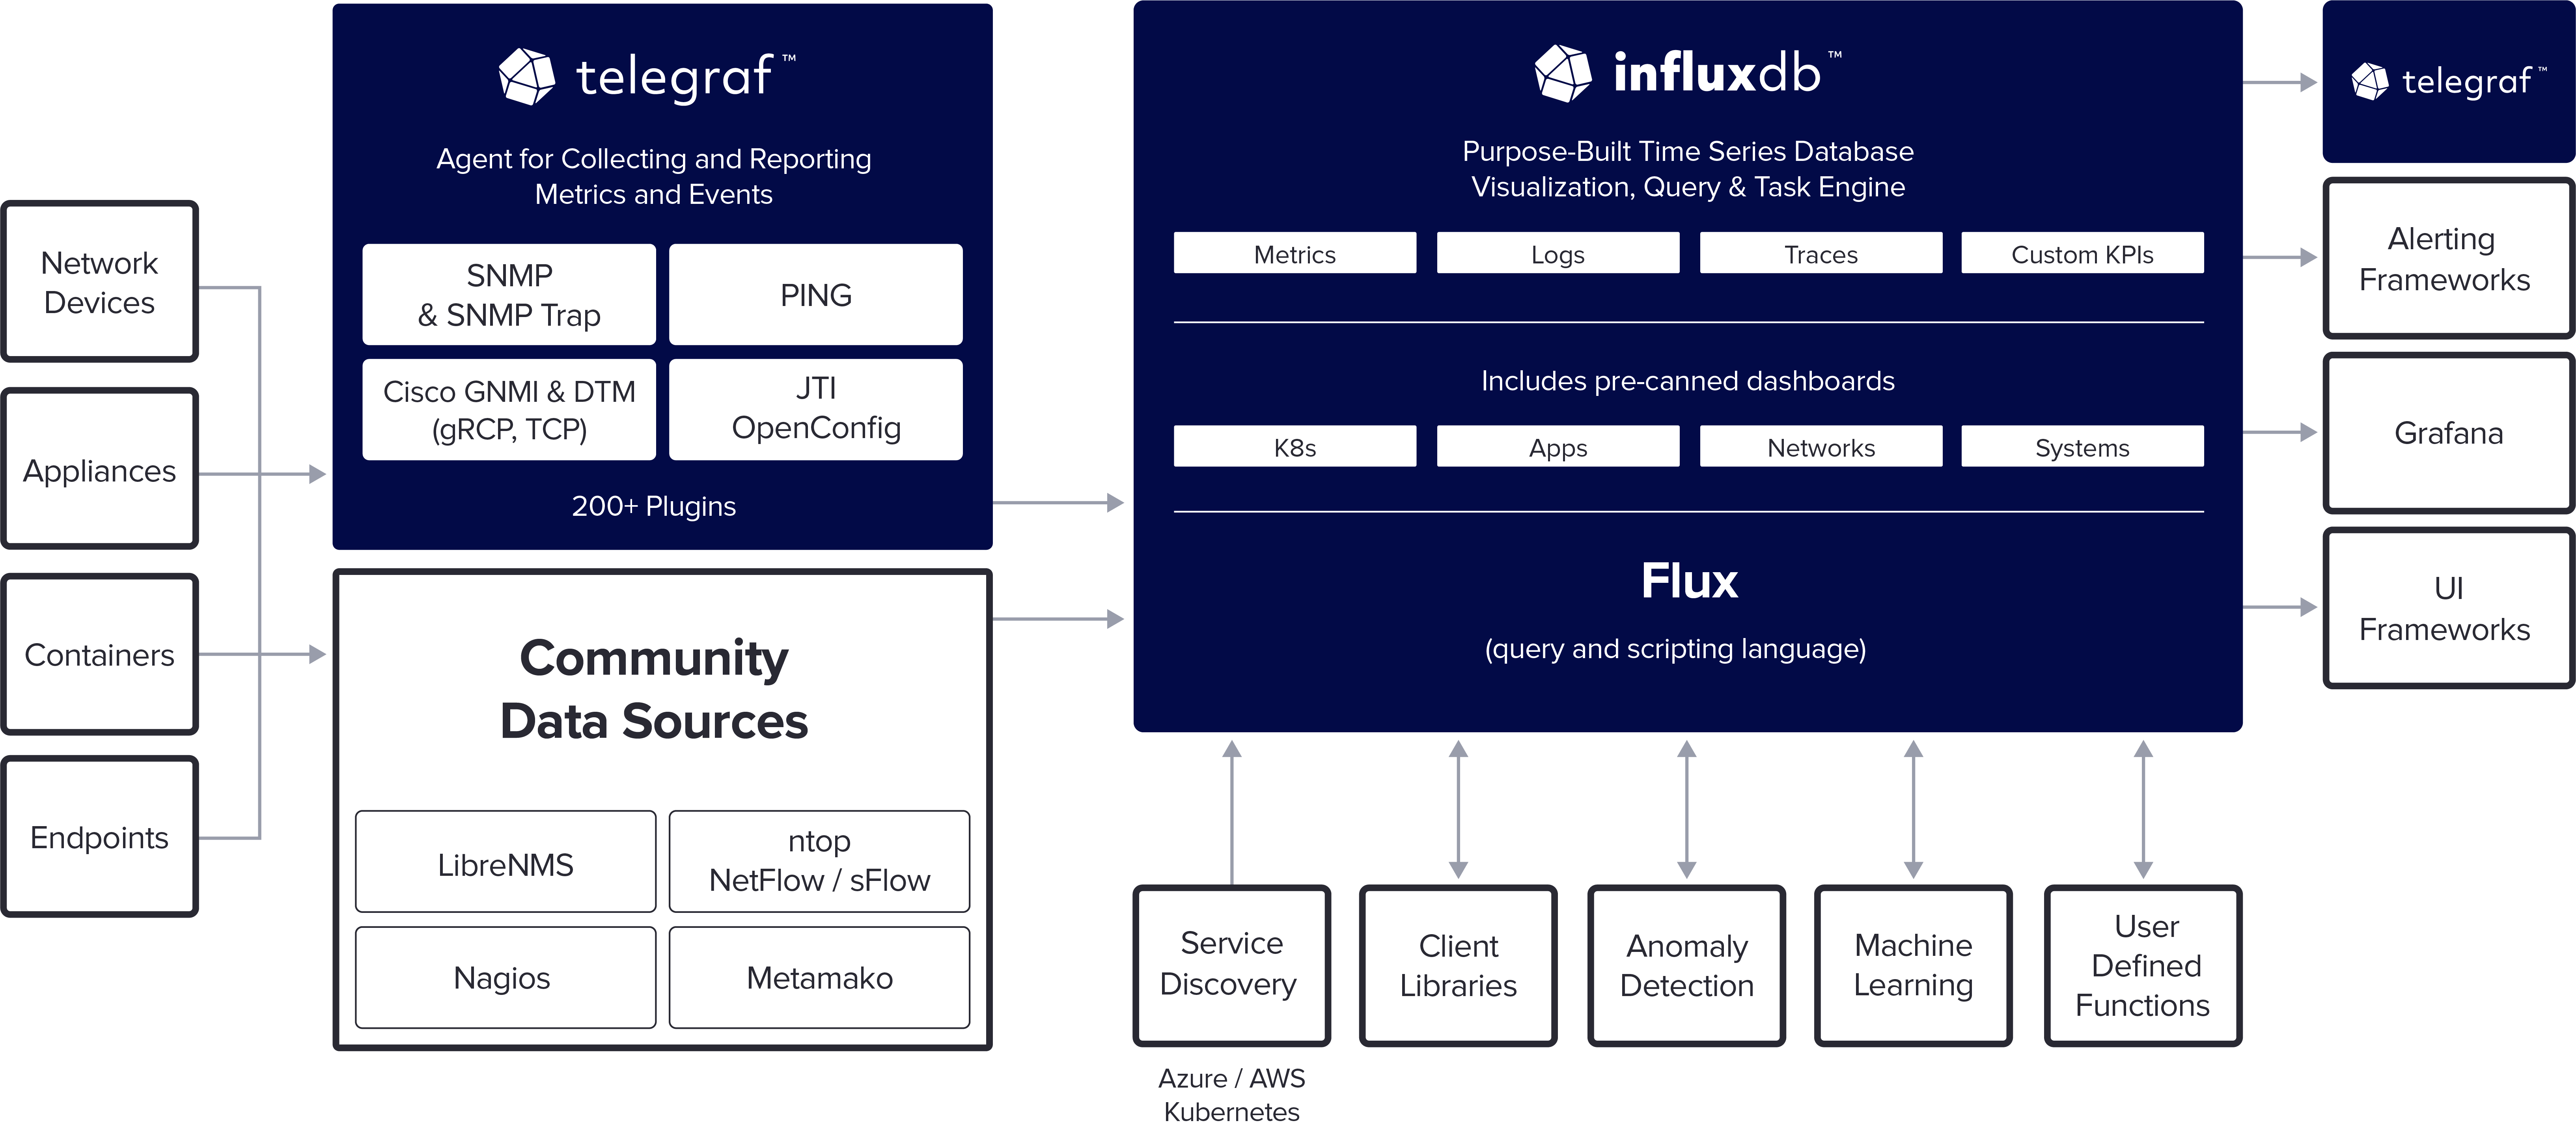
The functional architecture of the InfluxData network monitoring platform
Telegraf
Telegraf is the collection agent with 200 plugins and a vast client library, that can source metrics directly from the system it’s running on, pull metrics from third-party APIs, listen for metrics via streaming consumer services, and support monitoring protocols such as ICMP/Ping, SNMP, NETFlow and SFlow, as well as gathering metrics and logs with Syslog.
InfluxDB
InfluxDB is the database and storage engine purpose-built to handle time series data. A perfect metric store for multiple data sources to help you avoid a siloed approach. In InfluxDB 1.0, Chronograf (visualization tool with pre-canned dashboards with the standard baseline for network monitoring) and Kapacitor (rules engine for processing, monitoring, and alerting) are separate components of the TICK Stack. InfluxDB 2.0 comes with Chronograf and Kapacitor built-in.
Featured customers:

Vonage
Vonage, a UK-based cloud service company, chose InfluxData to provide 99.999% uptime monitoring of its global SaaS because InfluxData could meet and exceed its business and technical requirements. Grafana is used for all its graphing capabilities.

Coupa
In just 4 weeks, Coupa (a cloud platform for business spend), was able to go beyond building a proof-of-concept with InfluxData, and was able to create a working prototype that was kept simple and iterated upon often: It used Telegraf to collect data, a single InfluxDB node to store data, Grafana to visualize data, and Kapacitor to analyze data.

ntop
Using InfluxDB, ntopng is open to “big data” systems that can scale with data in volume and speed. It is able to export monitoring information in JSON format towards various systems including Elasticsearch/Logstash and ZMQ. ntopng is also able to collect, self-produce (from packets), and export monitoring information by normalizing it in JSON format.
Find more information about network monitoring plugins:
Network Monitoring
How to Monitor Your Network with InfluxData
Learn how to use InfluxData for your network monitoring to gain the necessary visibility in the status, performance and responsiveness of your enterprise, cloud or hybrid application environments. Get a faster and easier tool to start collecting data from multiple sources and quickly perform root-cause analysis reducing your MTTR.

